
Hello Central Kentucky!
If you’re in the process of buying or selling a home in Georgetown-Scott County, Kentucky or if you’re just curious about the current market there, you’ve come to the right place. Welcome to our update of the latest local real estate trends as of November 2023.
Prefer a video format? Visit our YouTube Channel: https://www.youtube.com/@century21simpsonassociates
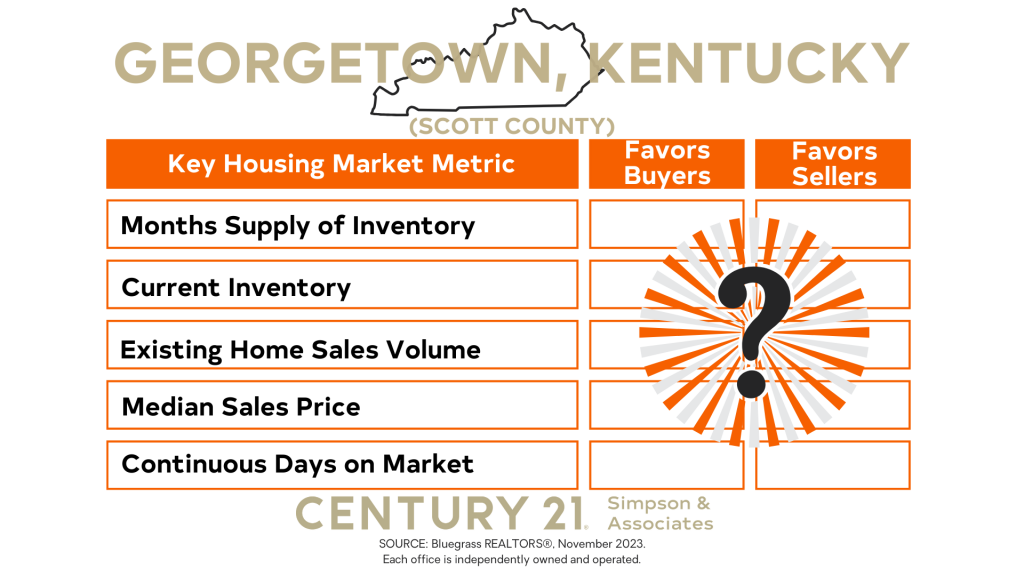
We’re going to unveil the five real estate indicators that are shaping the housing market in Georgetown-Scott County and how each impacts buyers and sellers. By the time we’re through, you’ll have a comprehensive understanding of who benefits given the current market conditions. We won’t leave it there though. We’ll also cover what buyers and sellers need to know to make the best real estate decisions.
And, we’re off!
Let’s start with the first indicator: Months Supply of Inventory. This indicator tells us how long the current inventory of properties in Georgetown-Scott County would last at the current rate of sales.
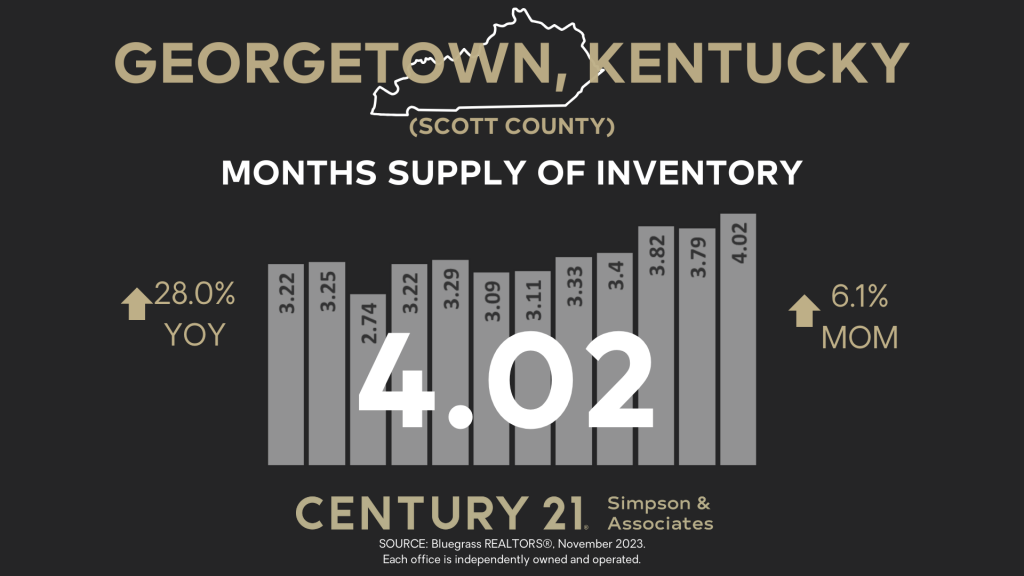
In November 2023, the Months Supply of Inventory stood at 4.02 months, indicating that if no new properties were added and sales remained steady, it would take just over 4 months, or around 120 days to sell all the properties on the market.
Compared to the previous month, the Months Supply of Inventory rose 6.1% indicating an increase in the time homes are on the market. Looking back a year, it was up by 28% or an additional 25 days.
Six months supply of inventory represents a balanced market, favoring neither buyers nor sellers. With the current 4.02 months supply of inventory, buyers find that they have a little more time to consider the available homes. For sellers, it indicates that the market is still moving at a quick pace. This presents a favorable environment for sellers looking to make a move in the current market conditions.
Now, let’s shift our focus to the Current Inventory. This indicator gives us a snapshot of the number of homes currently available for sale. It’s important to note that the number of homes on the market can vary as it depends on when the report is generated. By consistently using the same day each month, we can establish meaningful month-to-month trends.
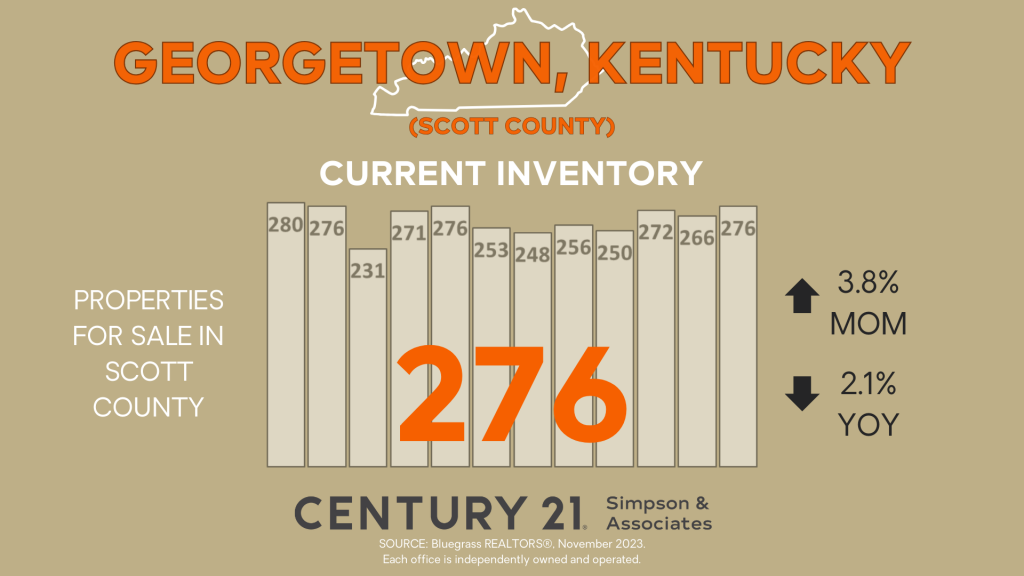
As of November 15th, there were 276 homes available on the market in Georgetown-Scott County. This represents a 3.8% increase compared to the previous month. When compared to last year, we observe a 2.1% decrease in the number of available homes.
With 276 homes on the market, buyers have a few more options to consider compared to last month. Buyers are more likely to find a home that perfectly matches their preferences and requirements.
But what about sellers? Sellers might be wondering if a higher inventory is beneficial. While a higher inventory means more competition among sellers, this doesn’t necessarily mean they’re at a disadvantage. With the right pricing and marketing approach, sellers can still stand out in the crowd.
Even with the increase in current inventory, this indicator continues to favor sellers.
Next, the Existing Home Sales Volume measures the total sale price value of properties whose sales contracts were completed during the month.
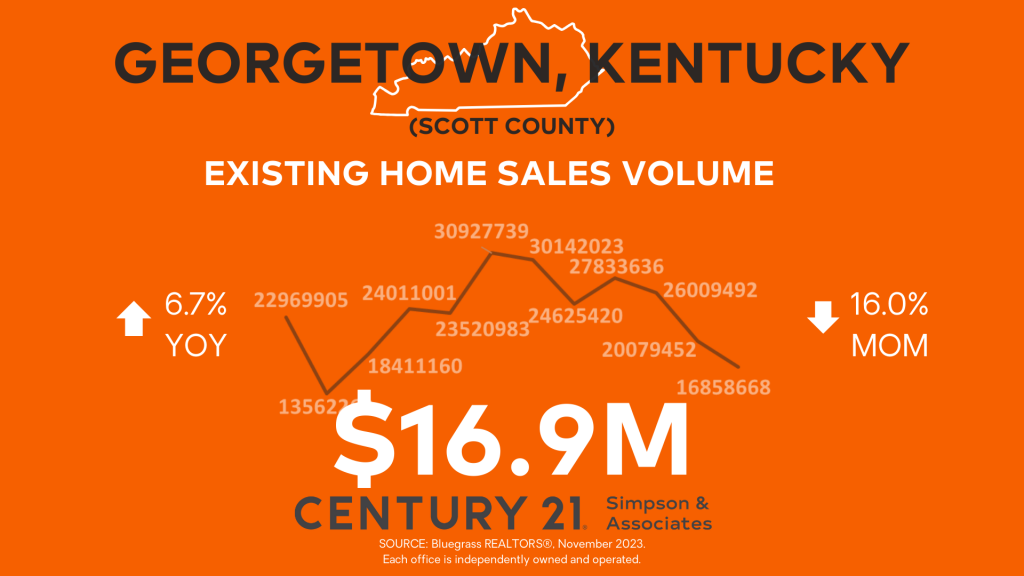
In November 2023, a total of 16.9 million dollars’ worth of property sold in Georgetown-Scott County. This represents a 16% decrease compared to the previous month. When compared to last year’s 15.8 million dollars’ worth of sold property, we observe an increase of 6.7%.
For buyers, this suggests that there’s considerably less activity in the market, meaning there is less competition because there are fewer buyers. For sellers, this means that they’re operating in a market that’s steadying itself. While it may not be as red-hot as it once was, it’s also not in a state of freefall.
It’s important to note that the Existing Home Sales Volume indicator provides a gauge of the market activity during this period and favors neither buyers nor sellers.
Now, let’s turn our attention to the Median Sales Price, the most requested real estate indicator. Median sales price provides insights into the midpoint price of homes sold in a specific area during a given month. Unlike the average sales price, the Median Sales Price eliminates the influence of exceptionally high-priced homes, giving us a more accurate representation of the market.
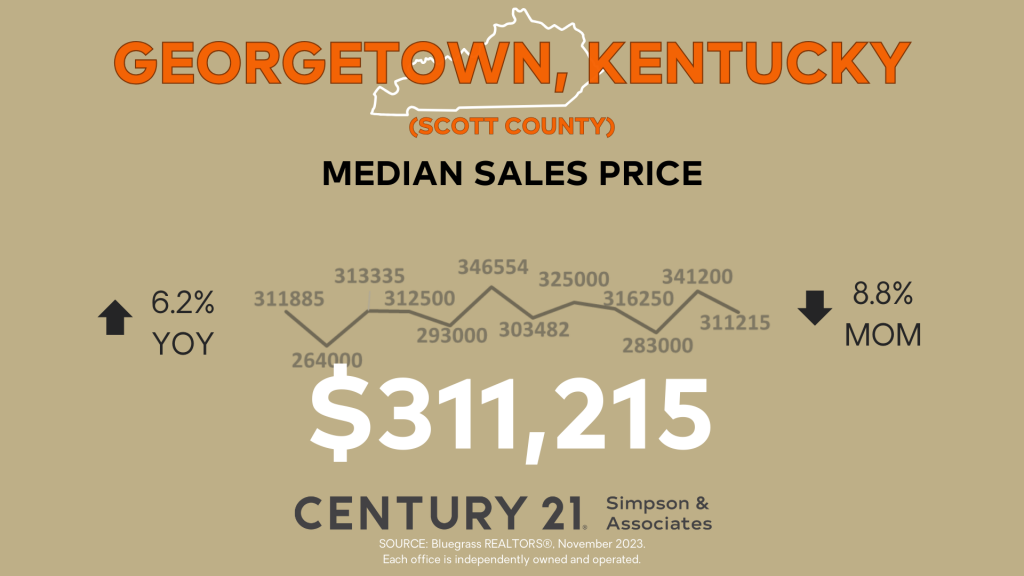
In November 2023, the median sales price for a home in Georgetown-Scott County stood at $311,215. This reflects a decrease of 8.8% compared to the previous month and is up 6.2% over last year.
For homebuyers, the decrease in the median sales price makes homes more affordable given the current interest rates. It may also encourage some buyers which could increase competition.
Sellers might be wondering what this decrease in median price means. This seems like a discouraging sign for anyone looking to sell their home. Despite the fluctuations, the market has retained its value compared to last year. The November 2023 median sales price is more than $18,000 above last year’s median sales price.
Even with the decrease in median sales price, it’s a reminder that this is still a seller’s market.
Before we summarize the 5 key indicators for November 2023 and reveal who benefits from the overall market in Georgetown-Scott County, let’s look at our last indicator. The Continuous Days on Market indicator provides insights into the average number of days it takes for a listing to go under contract. This calculation considers the period from when a property is listed until it is under contract, subtracting any days when the property was off the market.
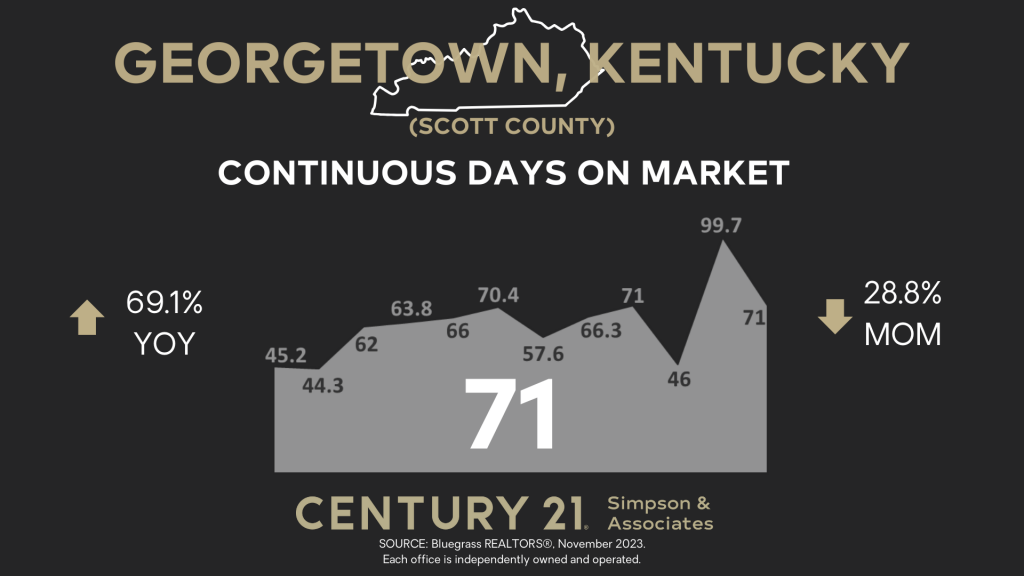
In November 2023, the continuous days on market for Georgetown-Scott County stood at 71 days. This represents a notable decrease of 28.8% compared to the previous month, indicating a faster pace of homes going under contract. When compared to last year, we observe a 69.1% increase in the continuous days on market.
For buyers, even with a slowing market, homes are going under contract faster which means you have to act swiftly when you find a property you love. With fewer days on market, the competition among buyers increases.
For sellers, it suggests the market is moving faster. Fewer days on market can mean less time, effort, and cost spent on property maintenance and holding costs.
This shift in the continuous days on market highlights the evolving aspects of the real estate market. The indicator favors sellers because of the sustained demand in the market
Now, let’s recap the insights we’ve gathered about the key local housing market indicators for November 2023 in Georgetown-Scott County, Kentucky.
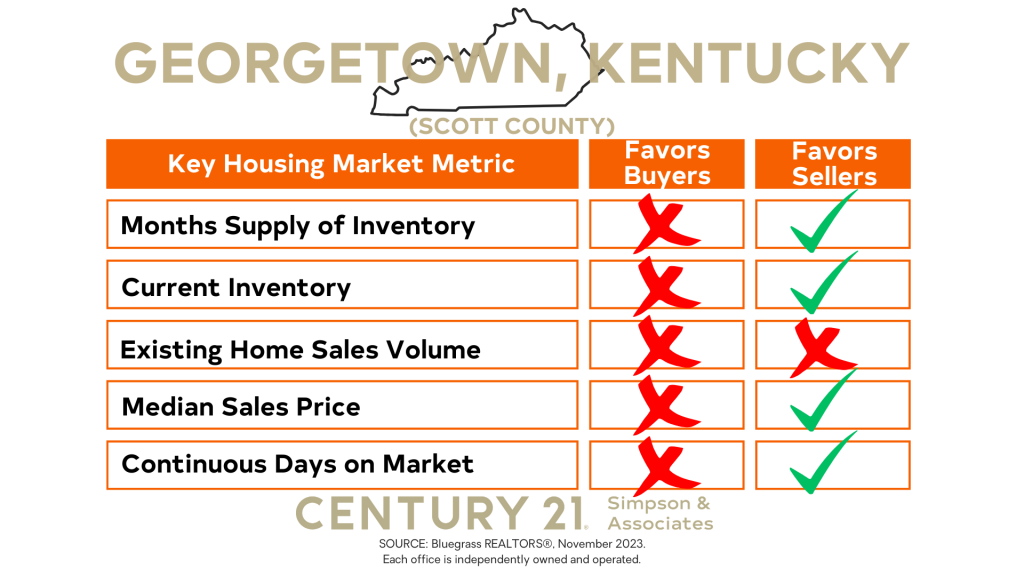
We determined that the Months Supply of Inventory favors sellers, indicating a low supply of homes available on the market. This creates an advantageous environment for sellers in terms of pricing and competition.
Current Inventory favors sellers even with the increase, inventory remains low.
The Existing Home Sales Volume, on the other hand, favors neither buyers nor sellers.
The Median Sales Price, reflecting the midpoint price of homes sold, also favors sellers. When compared to last year, the median sales price indicates a market where property is likely to hold its worth.
Lastly, the Continuous Days on Market indicator shows that homes are going under contract at a fast pace. This favors sellers who can find buyers quickly.
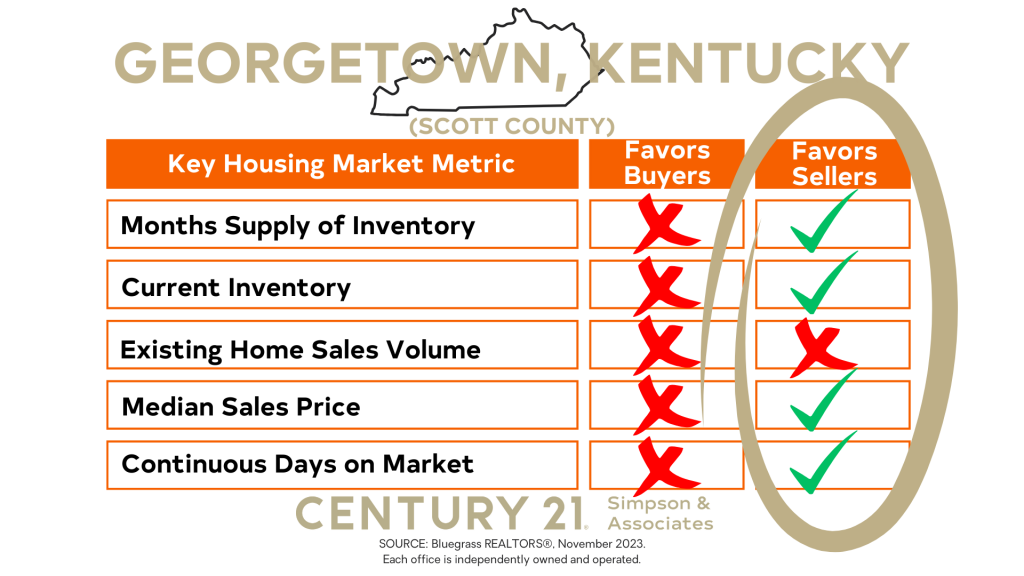
Considering these key indicators collectively, the overall market for November 2023 in Georgetown-Scott-County, Kentucky favors sellers.
Before we sign off, we want to provide some practical guidance for both buyers and sellers.
BUYERS
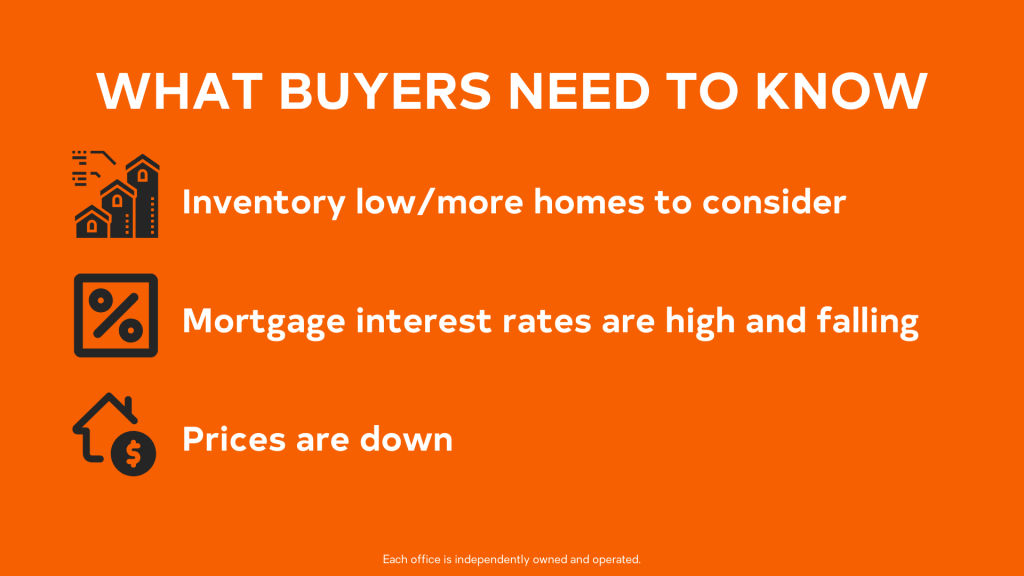
Inventory is low though there are more homes to consider when compared to last month.
Mortgage interest rates are high and falling. When interest rates move, decisive buyers have a narrow window to capitalize while others may pause to consider. Remember the adage, “Marry the home and date the rate”. If you find your home, you can potentially refinance as rates settle back down.
Prices are down from last month and are still above that of last year. With low inventory, it’s likely prices will go higher.
Given the low inventory and lower home prices, act decisively when you find the right house.
SELLERS
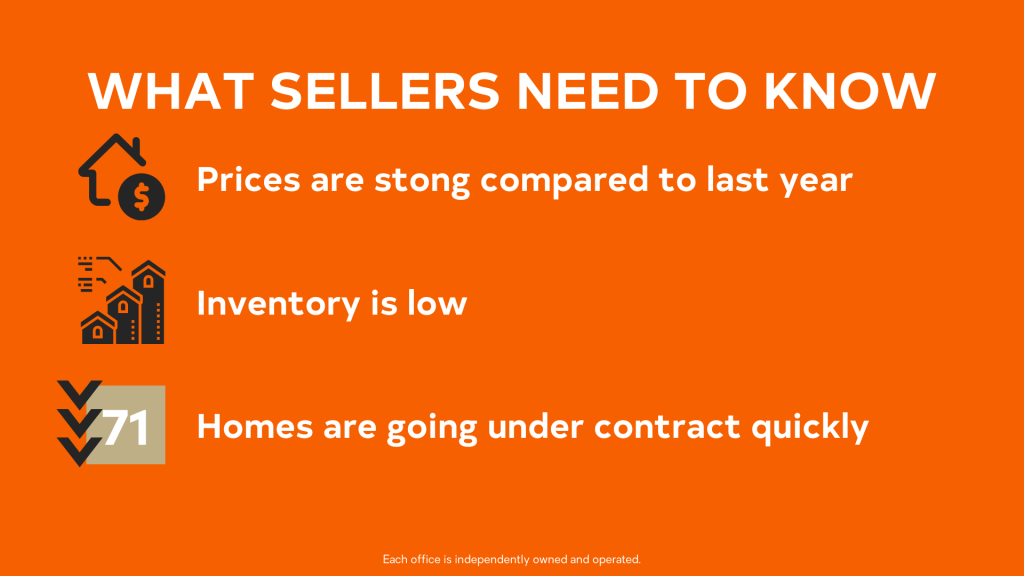
Timing the market is nearly impossible! The best we can do is read and react to the data available.
Prices are strong compared to last year! With low inventory levels, well-positioned listings with a great mix of price and condition sell quickly. Days on market is 71 days, which means homes are still going under contract quickly.
Have your REALTOR run the numbers based on the market and see if that achieves your financial goals. It’s best to act now if you’re ready to sell.
If you liked this market update, share it with a friend and please reach out if you have any questions or suggestions.
Our goal is to equip you with the knowledge you need to make informed real estate decisions in Georgetown-Scott County.
Each month, we explore the latest local real estate trends of Central Kentucky counties. In addition to Georgetown-Scott County, we provide updates on Frankfort-Franklin County, Lexington-Fayette County, Lawrenceburg-Anderson County, Versailles-Woodford County, and Nicholasville-Jessamine County. And if you’re interested in a broader perspective, be sure to watch our monthly national real estate metrics videos.
Leave us a comment and reach out if you have any questions. Please join us next month for more insights.


 Facebook
 X
X
 Pinterest
 Copy Link


