

 Facebook
 X
X
 Pinterest
 Copy Link
Attention Central Kentucky homeowners! Are you sitting on the fence, wondering if it’s the opportune moment to sell your home? Stay with us as we provide you with actionable insights to guide your decision-making process.
This is the National Real Estate Market Watch for May 2024 brought to you by CENTURY 21 Simpson & Associates.
Prefer a video format? Visit our YouTube Channel: https://www.youtube.com/@century21simpsonassociates
(Playlist: National Residential Real Estate Market Watch)
Is now the time to sell your home? The short answer continues to be yes according to the 5 national real estate market indicators.
Let’s start with the Months Supply of Inventory.
This indicator will tell us the balance between supply and demand in the real estate market and whether the current market favors buyers or sellers.
How long the current inventory of properties available for purchase would last at the current rate of sales.
Over the past nine months, the number of homes available for purchase has been relatively flat, ranging from 1 to 1.15 million but up from one year ago when inventory was 980,000.
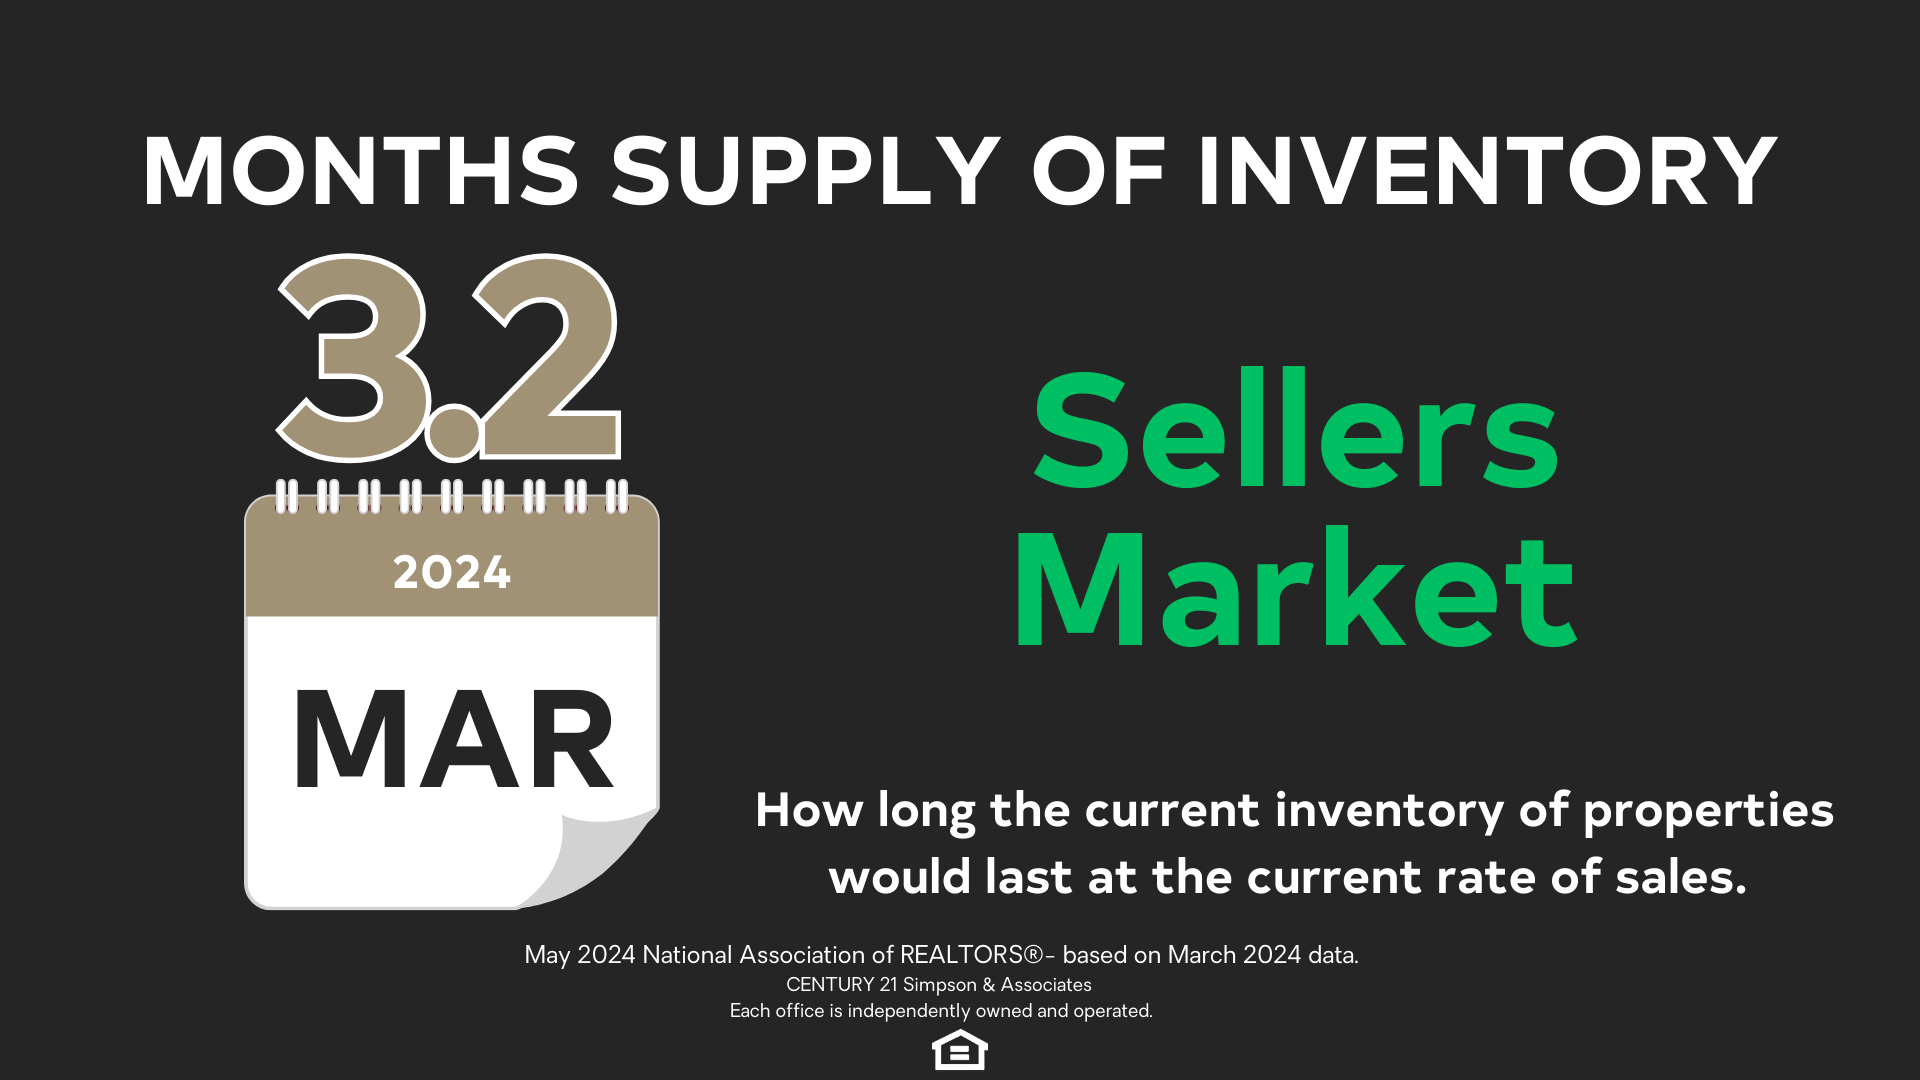
Meanwhile, the months’ supply of inventory, indicating how long it takes to sell current inventory at the current sales rate sits at a 3.2-month, up from 2.9 months in February but up from 2.7 months in March 2023.
NATIONAL ASSOCIATION OF REALTORS Chief Economist Lawrence Yun commented, “More inventory is always welcomed in this market. Frankly, it’s a great time to list with ongoing multiple offers on mid-priced properties and, overall, home prices continuing to rise.”
Six months of inventory represents a balanced market, favoring neither buyer nor seller. When Months Supply of Inventory is below 6 months, it is considered a sellers’ market.
For context, over the past decade, the average months’ supply of inventory was 3.8 months, however at 3.2 months’ supply of inventory the market continues to favor sellers which means there are not enough homes on the market to meet buyer demand and that sellers have more negotiating power than buyers.
Our second indicator is Existing Home Sales.
This indicator tells us about the pace of the market. A faster pace favors sellers.
Existing home sales is the total number of all the properties whose sales contracts were completed, or closed, during the month.
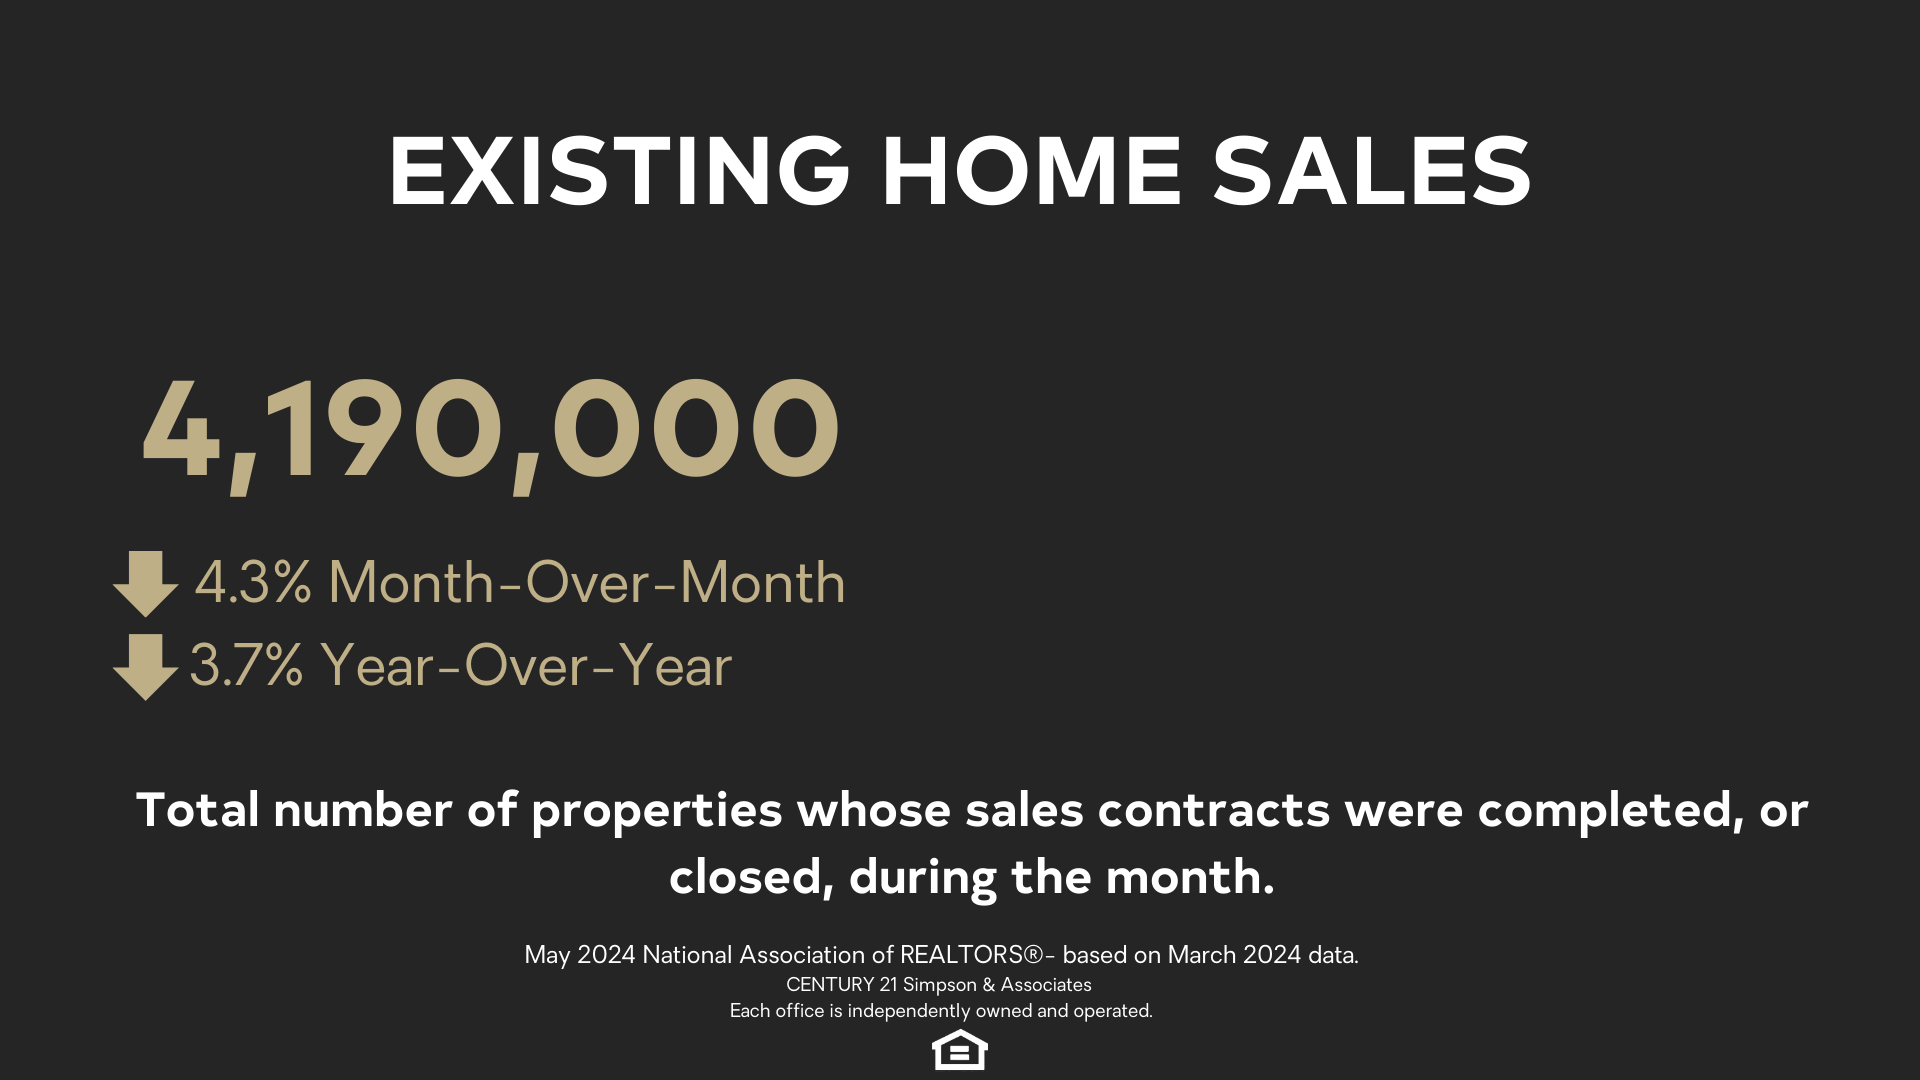
Existing-home sales slipped 4.3% in March to a seasonally adjusted annual rate of 4.19 million. Year-over-year sales fell 3.7% – down from 4.35 million in March 2023.
March sales are based on closings from contracts likely signed in January and February. Mortgage rates stayed lower in January, in the mid-6% range and then just shy of 7% in February.
According to NATIONAL ASSOCIATION OF REALTORS Chief Economist Lawrence Yun, “Though rebounding from cyclical lows, home sales are stuck because interest rates have not made any major moves. There are nearly six million more jobs now compared to pre-COVID highs, which suggests more aspiring home buyers exist in the market.”
First-time buyers were responsible for 32% of sales in March, up from 26% in February and 28% in March 2023. According to NATIONAL ASSOCIATION OF REALTORS’s 2023 Profile of Home Buyers and Sellers the annual share of first-time buyers was 32%. Roughly 40% is the historical norm.
Sellers ready to list their homes should be encouraged because buyer demand still exceeds supply.
As buyers accept the “new normal” for mortgage rates, they will re-enter the market creating more competition.
Next is the most-requested indicator, Median Sales Price.
This indicator helps us understand the core pricing trends of the market.
The median is the price where half of the homes sold in any given area that month were cheaper, and half were more expensive.
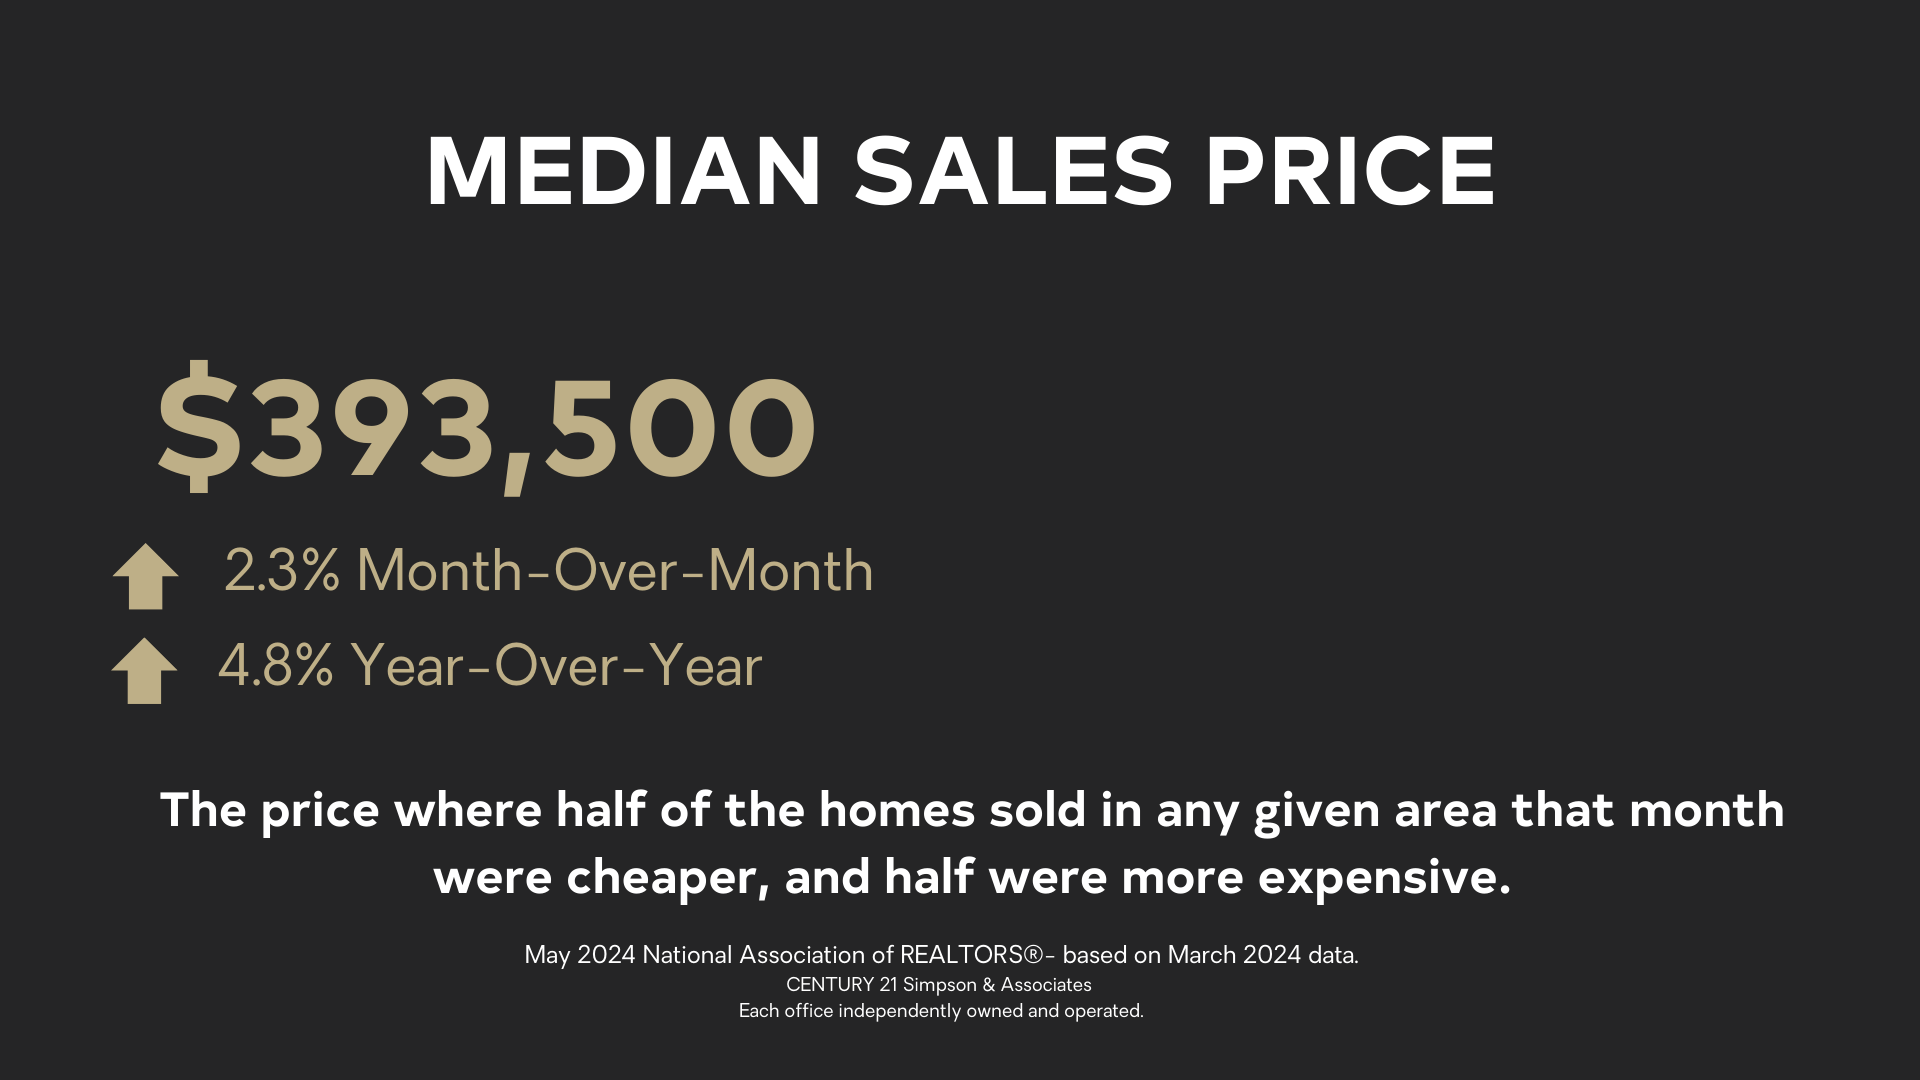
The median existing-home sales price rose 4.8% from March 2023 to $393,500 – the ninth consecutive month of year-over-year price gains and the highest price ever for the month of March.
Sellers still have an opportunity to capitalize on historically high prices and continued buyer demand.
Current Mortgage Rates
As a seller, mortgage interest rates are important because they determine the size of the pool of potential buyers and the speed of the selling process.
Mortgage interest rates vary by area, lender, and type of financing. For reference, we look at the national rate for a 30-year fixed-rate mortgage.
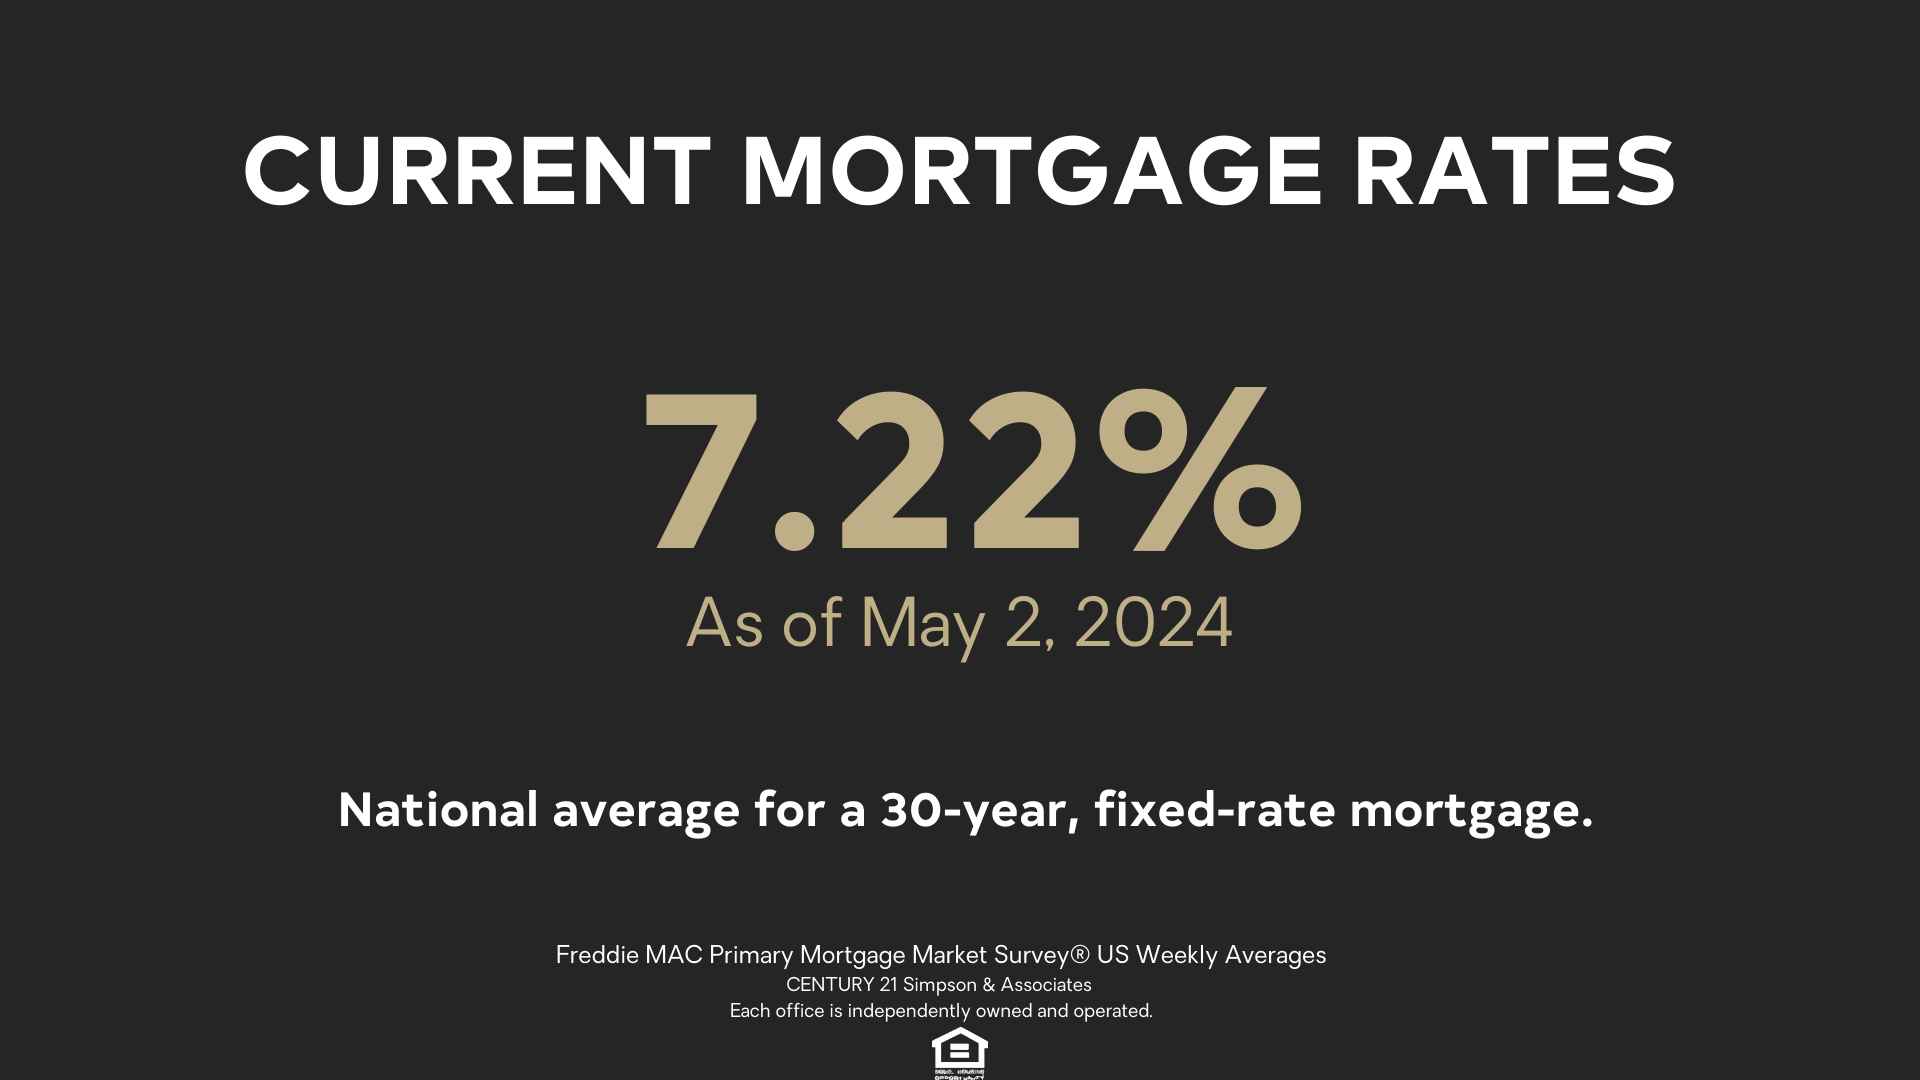
According to Freddie Mac, the 30-year fixed-rate mortgage increased for the fifth consecutive week to 7.22% as we enter the heart of Spring Homebuying Season. On average, more than one-third of home sales for the entire year occur between March and June. With two months left of this historically busy period, potential homebuyers will likely not see relief from rising rates anytime soon. However, many seem to have acclimated to these higher rates, as demonstrated by the recently released pending home sales data coming in at the highest level in a year.
Jessica Lautz, NATIONAL ASSOCIATION OF REALTORS Deputy Chief Economist and VP of Research says, “Mortgage interest rates are unlikely to move down soon, especially in light of yesterday’s Federal Reserve announcement—Fed Fund rates are unaltered for the 6th meeting. The Fed is holding the line until inflation cools further, which is not helping home buyers.”
For sellers, even though interest rates are pricing some buyers out of the market, demand still exceeds supply.
Our final indicator is Days on Market.
The Days on Market indicator helps us determine if our pricing is correct or if there is some other market resistance, potentially leading to reduced buyer interest and negotiating power.
The Days on Market is the average number of days that sold listings were on the market. Those days are calculated from the day a property is listed until it goes under contract.
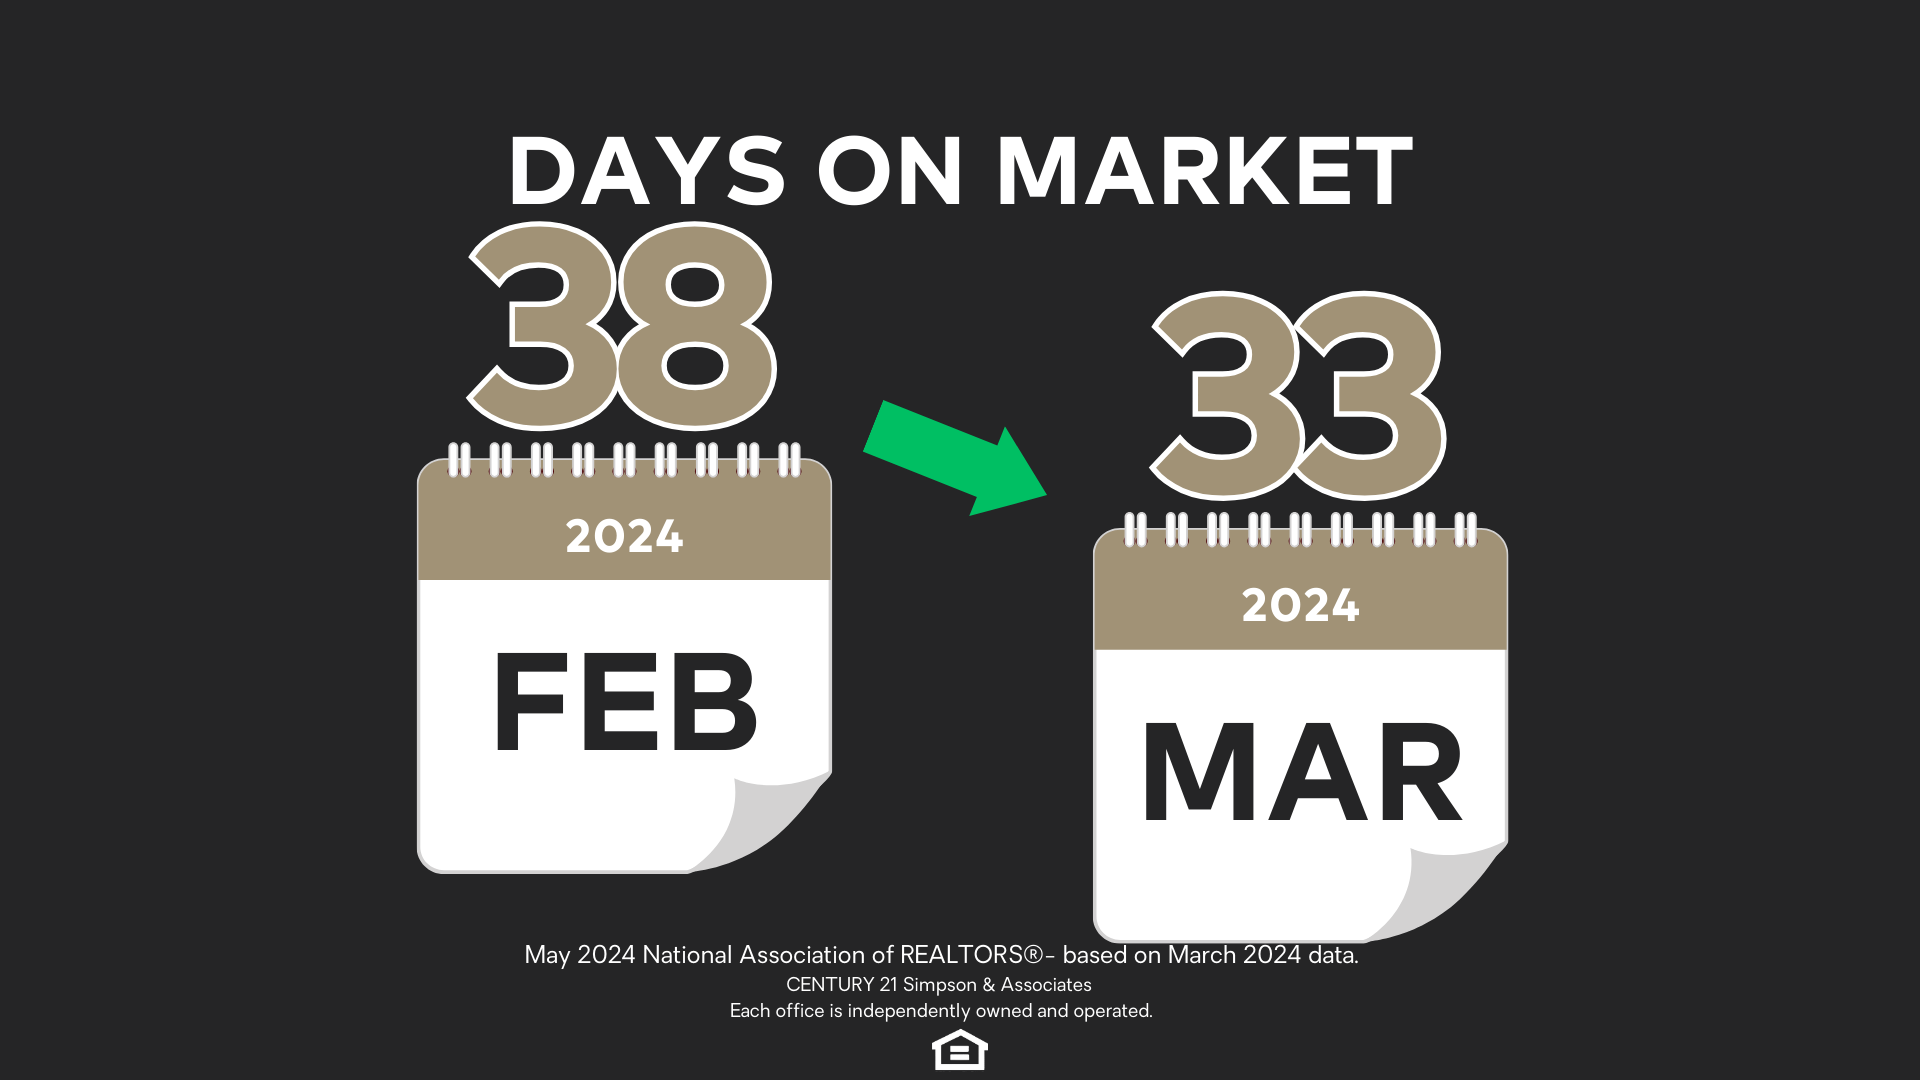
The spring housing market is getting more competitive and moving faster. The typical home sat on the market for just 33 days compared with 38 days in February.
With supply still limited relative to demand, 29% of homes sold above list price, up from 20% in February and 28% a year ago. As competition increases, more buyers could start acting fast.
Let’s recap what sellers need to know and summarize some actionable insights for anyone considering selling their home.
- Tight inventory continues to be a major factor fueling this market. With 1.1 million properties and 3.2 months of listings on the market, the market continues to strongly favor sellers.
- Prices in March were up 4.8% compared to last year. Tight inventory and strong buyer demand could lead to more price increases this year.
- Rates are still below the high of 7.8% in October of last year. Buyer demand indicates that buyers who can afford to buy are still in the market.
- Homes were on the market for 33 days in March. With supply still limited relative to demand, almost a third of homes sold above list price.
If you have a home to sell and were feeling like you missed your window, don’t miss this one.
At CENTURY 21 Simpson & Associates, we understand that the process of selling a home can be stressful and uncertain. If you are considering selling your home, let us or have your REALTOR run the numbers based on the market and see if that achieves your financial goals.
Timing the market is nearly impossible! The best we can do is read and react to the data available, and it’s sending a clear message: If you’re ready to sell, it’s best to act now!
Call our Frankfort Office or reach out to one of our real estate agents if you are interested in comparing the indicators in this national market watch with those of Central Kentucky counties or if you have any questions about the current real estate market.


