
 Facebook
 X
X
 Pinterest
 Copy Link
Attention Central Kentucky homeowners! Are you sitting on the fence, wondering if it’s a good time to sell your home? Stay with us as we provide you with actionable insights to guide your decision-making process.
This is the National Real Estate Market Watch for April 2024 brought to you by CENTURY 21 Simpson & Associates.
Prefer a video format? Visit our YouTube Channel: https://www.youtube.com/@century21simpsonassociates
(Playlist: National Residential Real Estate Market Watch)
Is now the time to sell your home?
The short answer is yes. Why? The national real estate market indicators have the answers.
Let’s start with the Months Supply of Inventory.
This indicator will tell us the balance between supply and demand in the real estate market and whether the current market favors buyers or sellers.
Over the past eight months, the number of homes available for purchase has been relatively flat, ranging from 1 to 1.15 million but up from one year ago when inventory was 970,000.
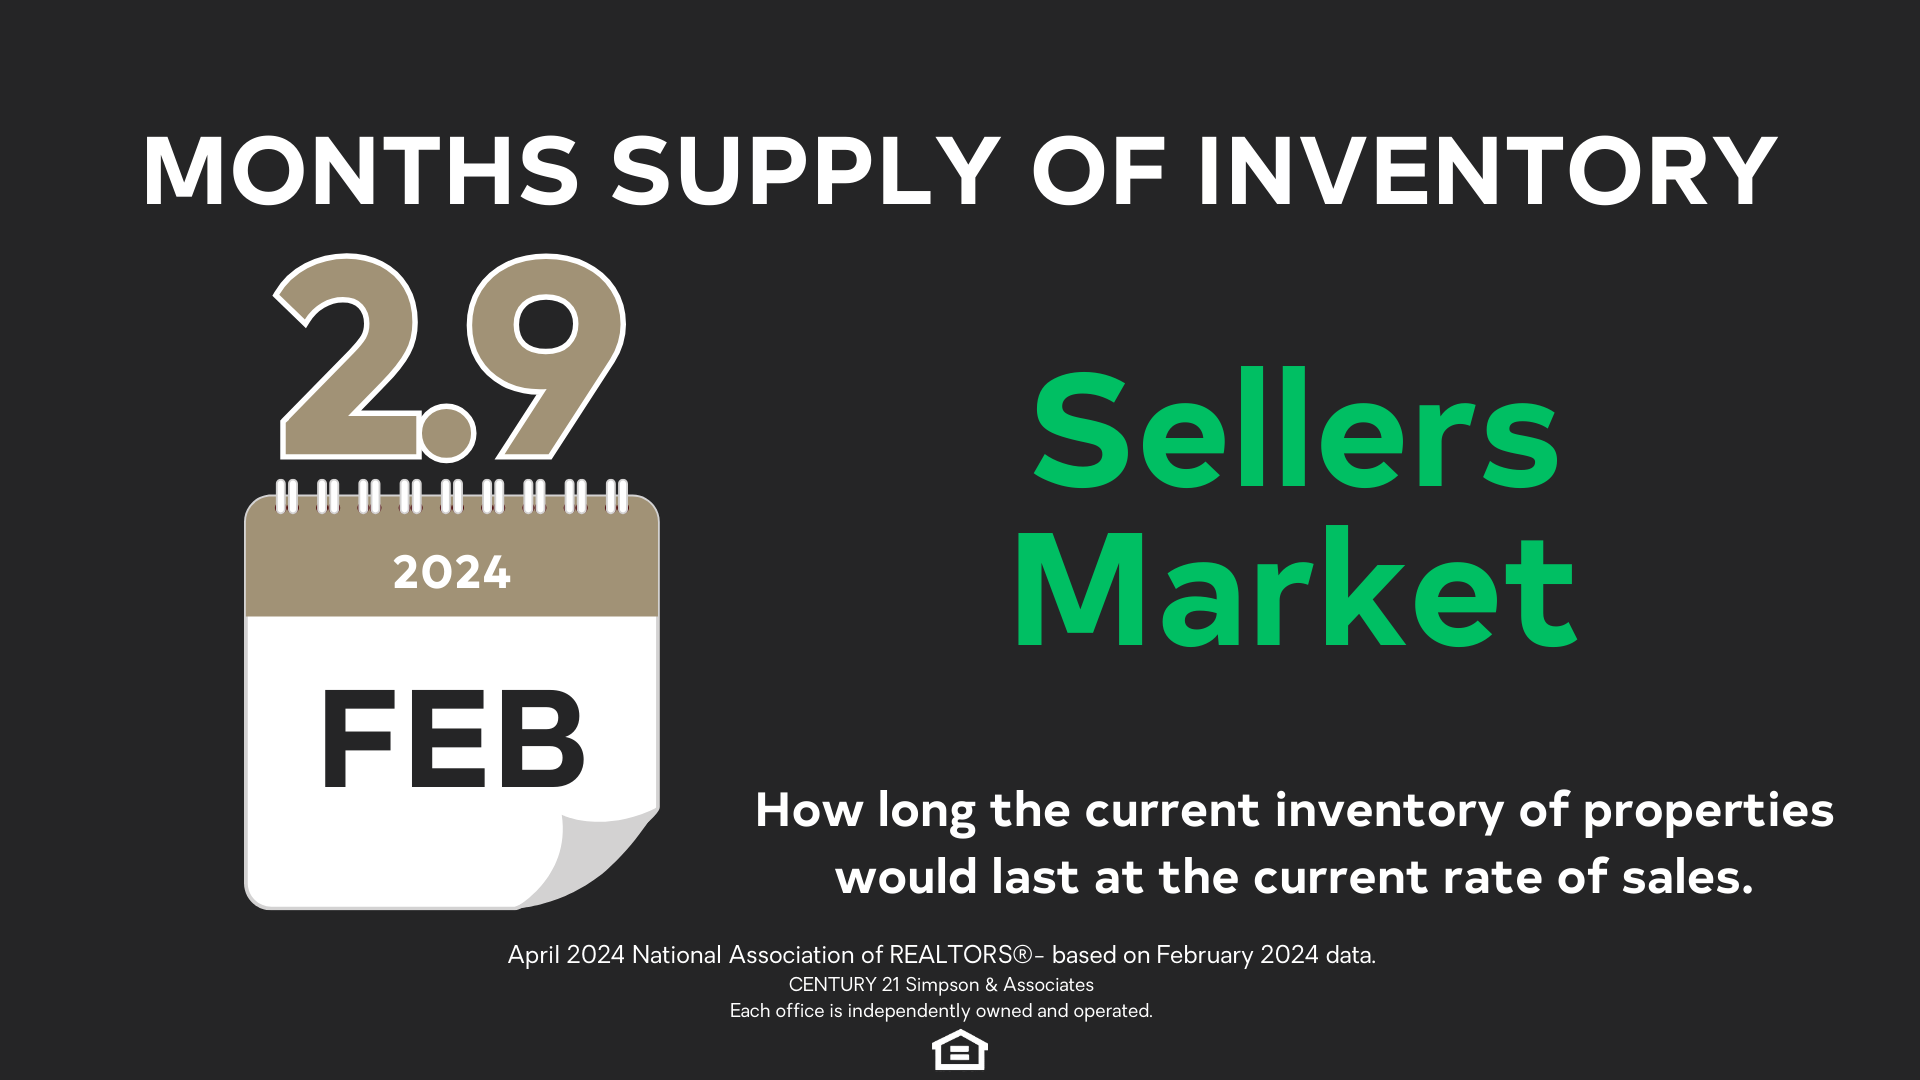
Meanwhile, the months’ supply of inventory, indicating how long it takes to sell the current inventory at the current sales rate, sits at a 2.9-months supply at the current sales pace, down from 3.0 months in January but up from 2.6 months in February 2023.
Six months of inventory represents a balanced market, favoring neither buyer nor seller. When Months Supply of Inventory is below 6 months, it is considered a sellers’ market.
For context, over the past decade, the average months’ supply of inventory was 3.8 months, however at 2.9 months’ supply of inventory the market continues to favor sellers which means there are not enough homes on the market to meet buyer demand and that sellers have more negotiating power than buyers.
Our second indicator is Existing Home Sales.
This indicator tells us about the pace of the market. A faster pace favors sellers.
Existing home sales is the total number of all the properties whose sales contracts were completed, or closed, during the month.
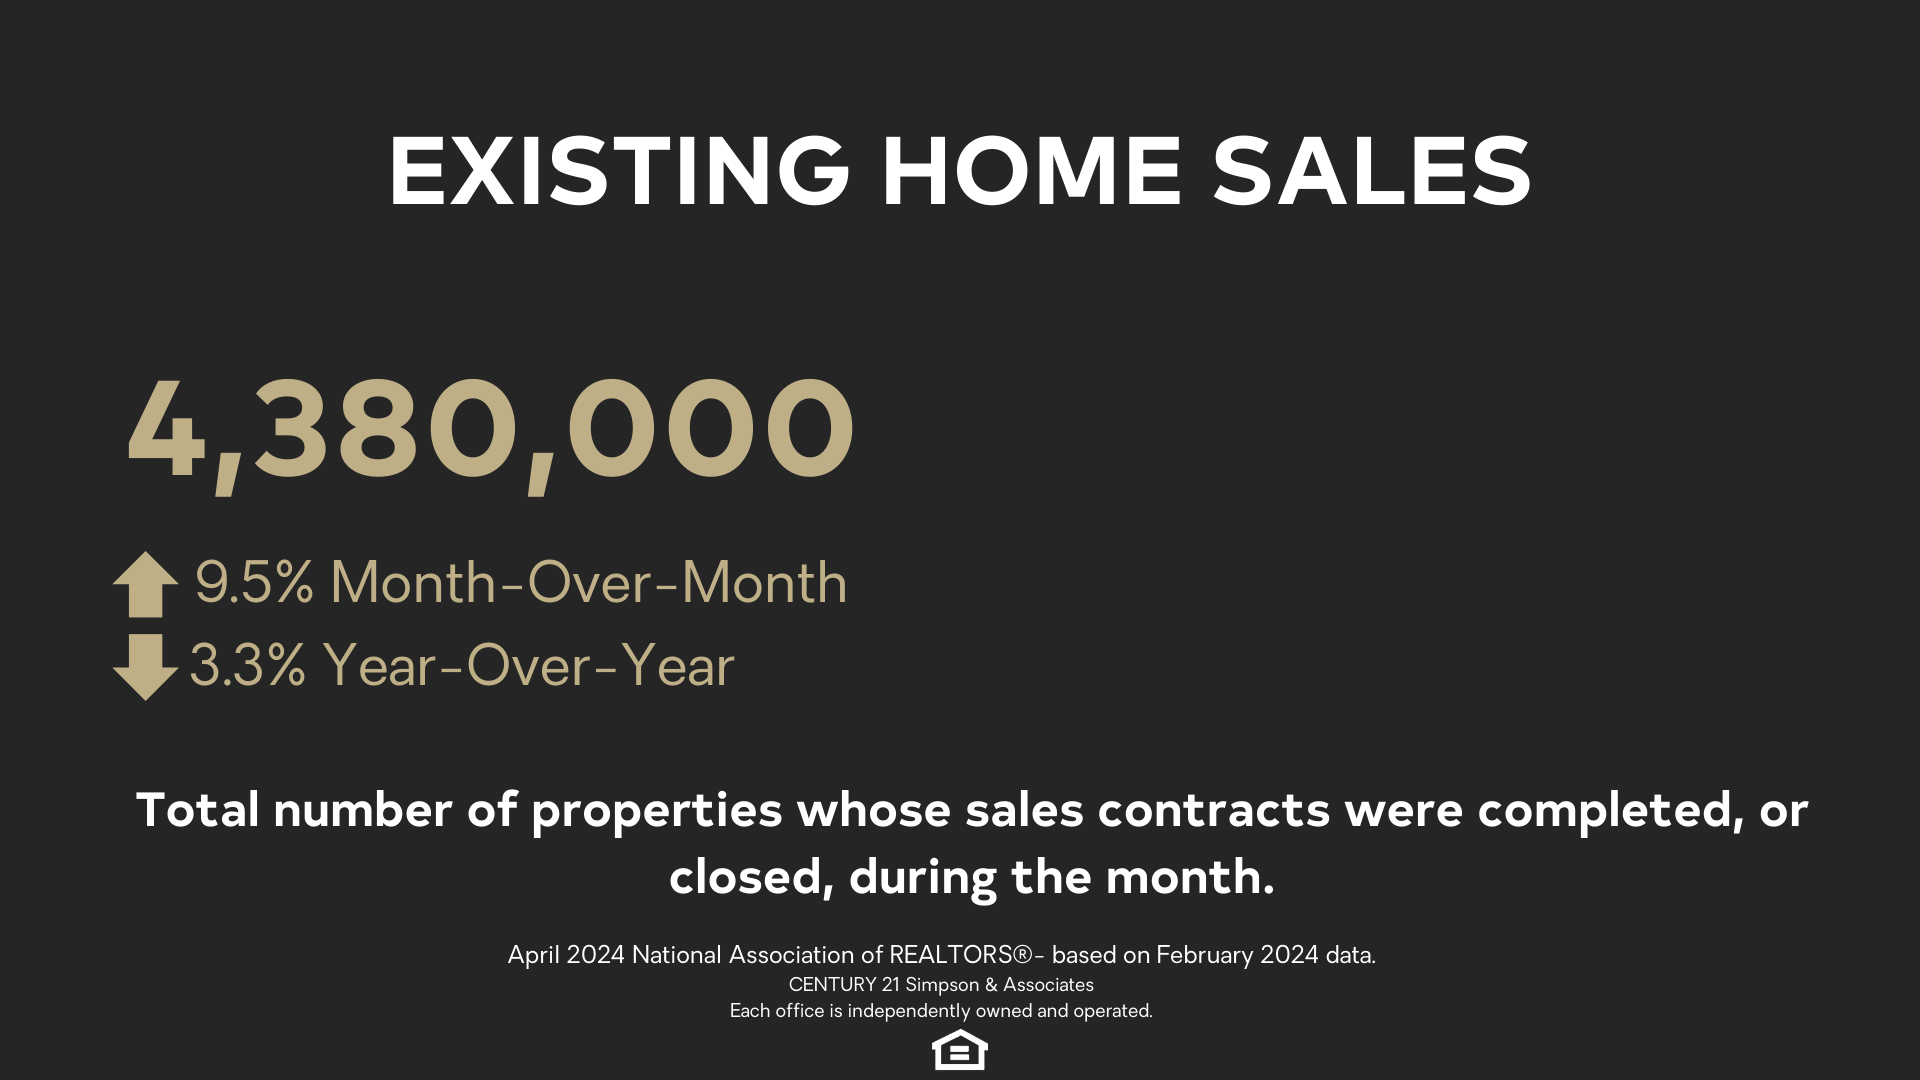
In February 2023, 4.38 million homes were sold. Month over month, home sales increased from January to February—the largest monthly gain in a year. Year-over-year however, sales slid 3.3% – down from 4.53 million in February 2023.
The sales count is based on closings, likely contracts signed in December and January, when the 30-year fixed mortgage rate dropped to the mid 6% range.
According to National Association of REALTORS Chief Economist Lawrence Yun, “Additional housing supply is helping to satisfy market demand. Housing demand has been on a steady rise due to population and job growth, though the actual timing of purchases will be determined by prevailing mortgage rates and wider inventory choices.”
First-time buyers did not surge with overall sales. Affordability is still impacting the first-time home buyer market—First-time buyers were responsible for 26% of sales in February, down from 28% in January and 27% in February 2023. Roughly 40% is the historical norm.
Sellers ready to list their homes should be encouraged because buyer demand still exceeds supply.
As buyers accept the “new normal” for mortgage rates, they will re-enter the market creating more competition.
Next is the most-requested indicator, Median Sales Price.
This indicator helps us understand the core pricing trends of the market.
The median is the price where half of the homes sold in any given area that month were cheaper, and half were more expensive.
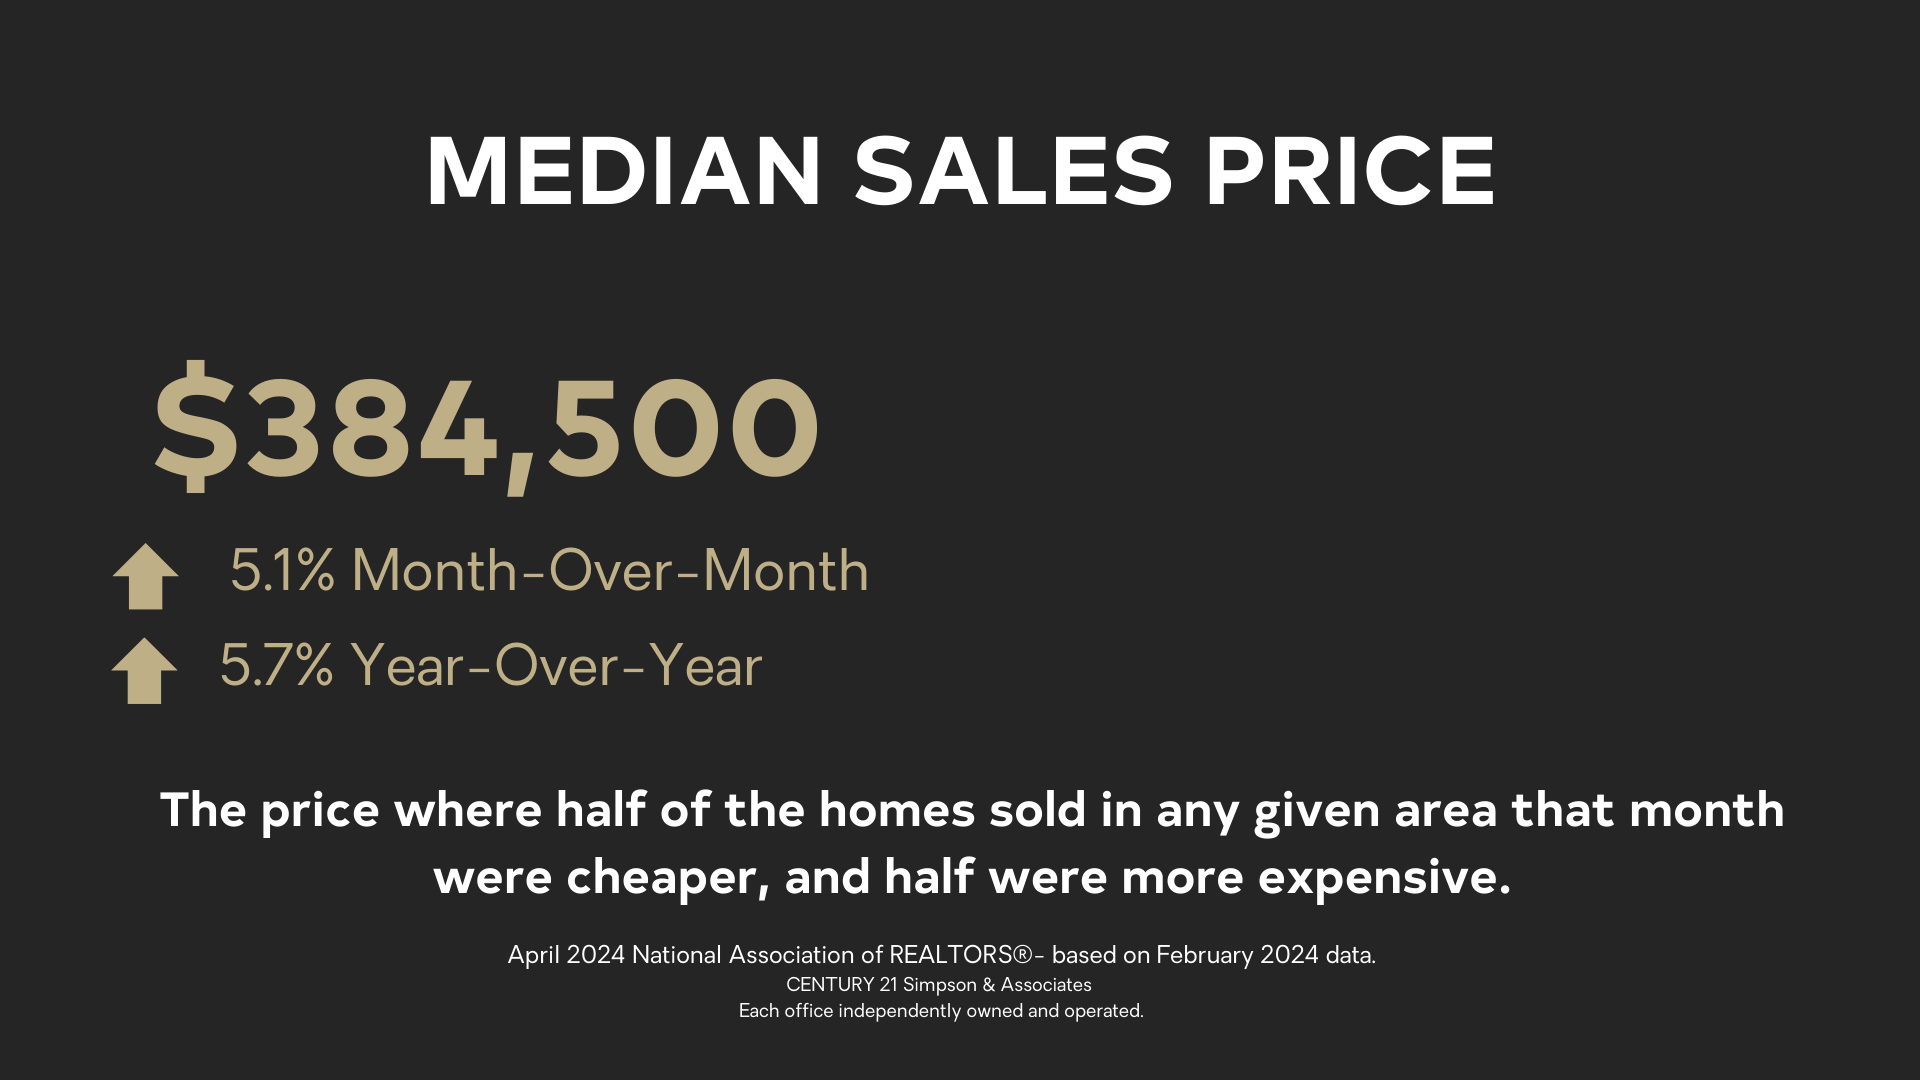
Higher demand continued to push the median existing-home sales price higher, up 5.7% from last year when it was $363,600 – the eighth consecutive month of year-over-year price gains
Sellers still have an opportunity to capitalize on historically high prices and continued buyer demand.
Current Mortgage Rates
As a seller, mortgage interest rates are important because they determine the size of the pool of potential buyers and the speed of the selling process.
Mortgage interest rates vary by area, lender, and type of financing. For reference, we look at the national rate for a 30-year fixed-rate mortgage.
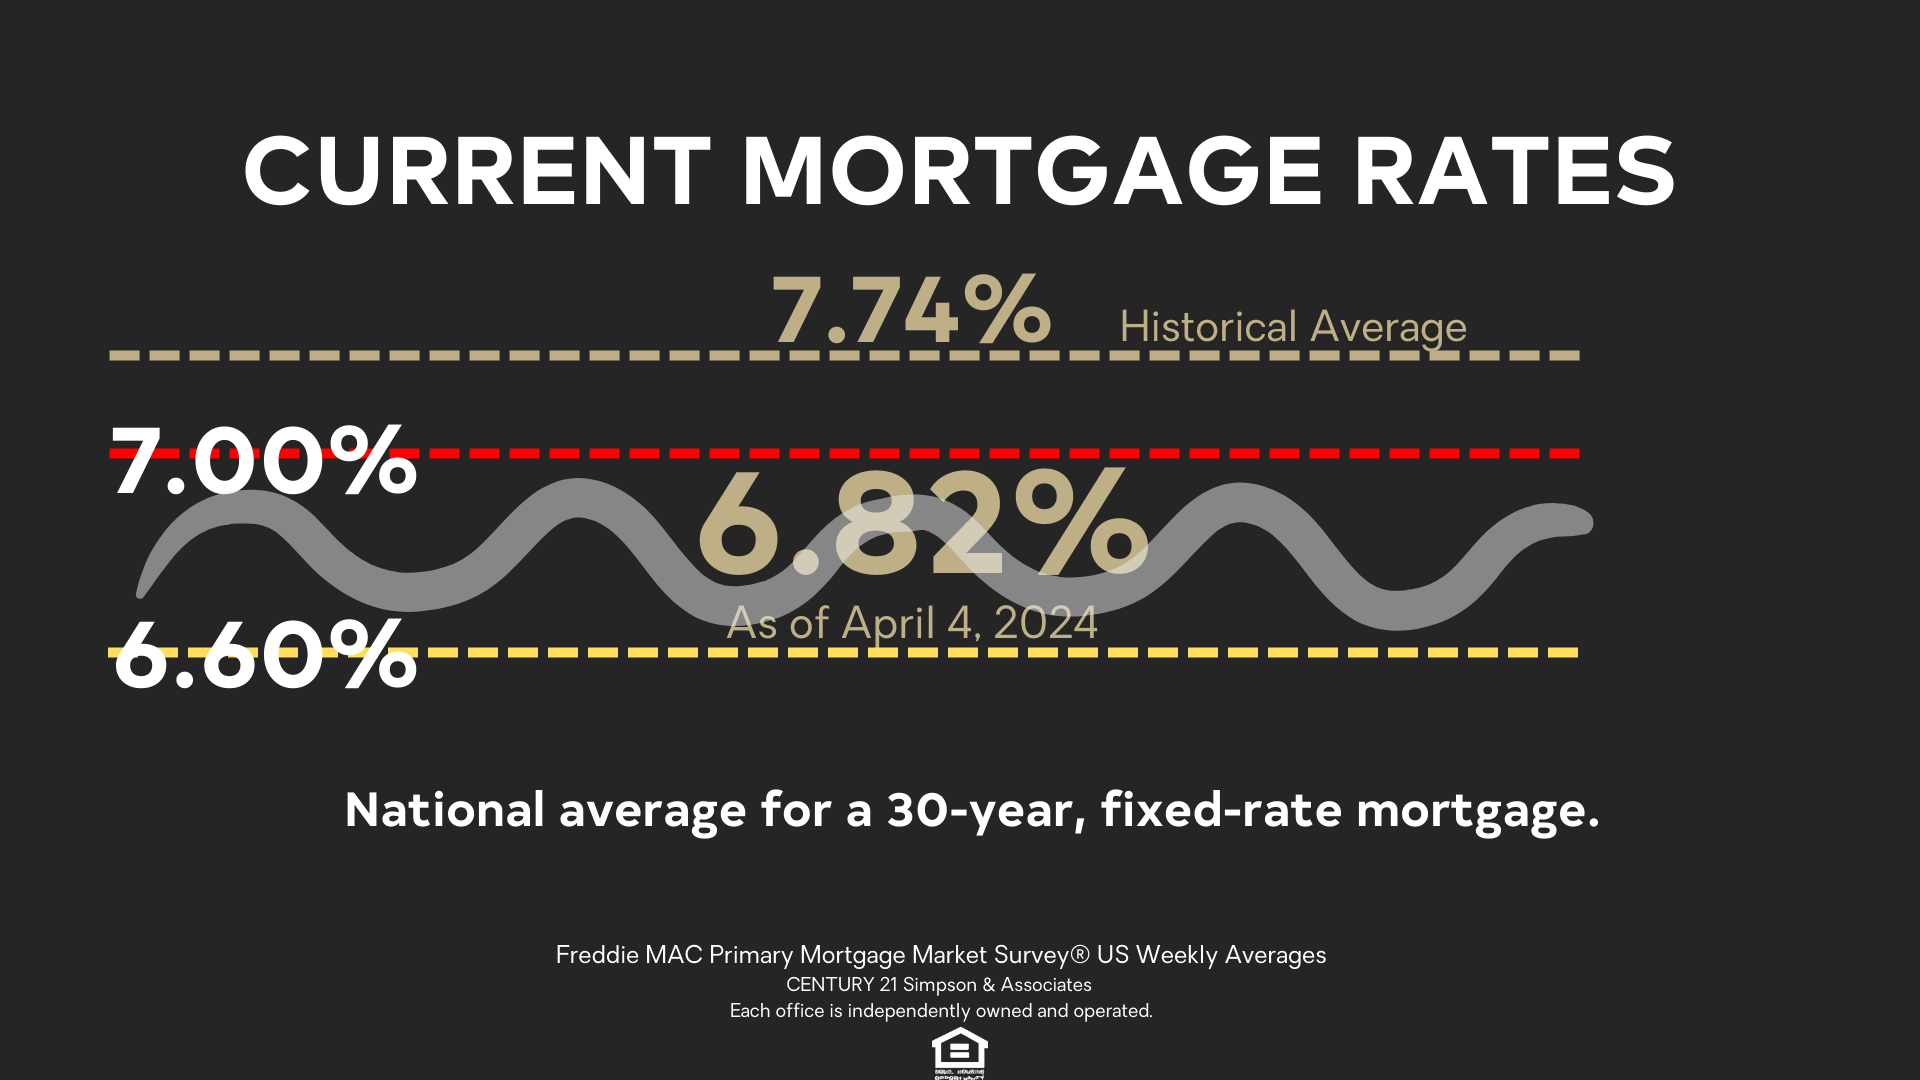
Mortgage rates showed little movement again, hovering around 6.8 percent. Since the start of 2024, the 30-year fixed-rate mortgage has not reached seven percent but has not dropped below 6.6 percent either.
While incoming economic signals indicate lower rates of inflation, rates are not expected to decrease meaningfully in the near-term. On the plus side, inventory is improving somewhat, which should help temper home price growth.
For home buyers purchasing a $400,000 home with a 20% down payment at a 6.82% interest rate would have a monthly mortgage payment of $2,090.
However, according to Jessica Lautz, NAR Deputy Chief Economist and VP of Research, “The typical first-time buyer does not put 20% down. Last year, the typical first-time buyer had a down payment of 8%.”
In that scenario, for a home buyer purchasing a $400,000 home with an 8% down payment at a mortgage interest rate of 6.82%, the mortgage payment would be $2,404.
Housing affordability is one reason the share of first-time buyers (at 26%) matched the lowest share ever recorded dating back to 2008. Inventory is the second critical component. First-time buyers need, value, and rely on real estate agents to help find the right home and with negotiations.
Buyers who are priced out of the market may sit on the sideline and wait for rates to fall.
Our final indicator is Days on Market.
The Days on Market indicator helps us determine if our pricing is correct or if there is some other market resistance, potentially leading to reduced buyer interest and negotiating power.
The Days on Market is the average number of days that sold listings were on the market. Those days are calculated from the day a property is listed until it goes under contract.
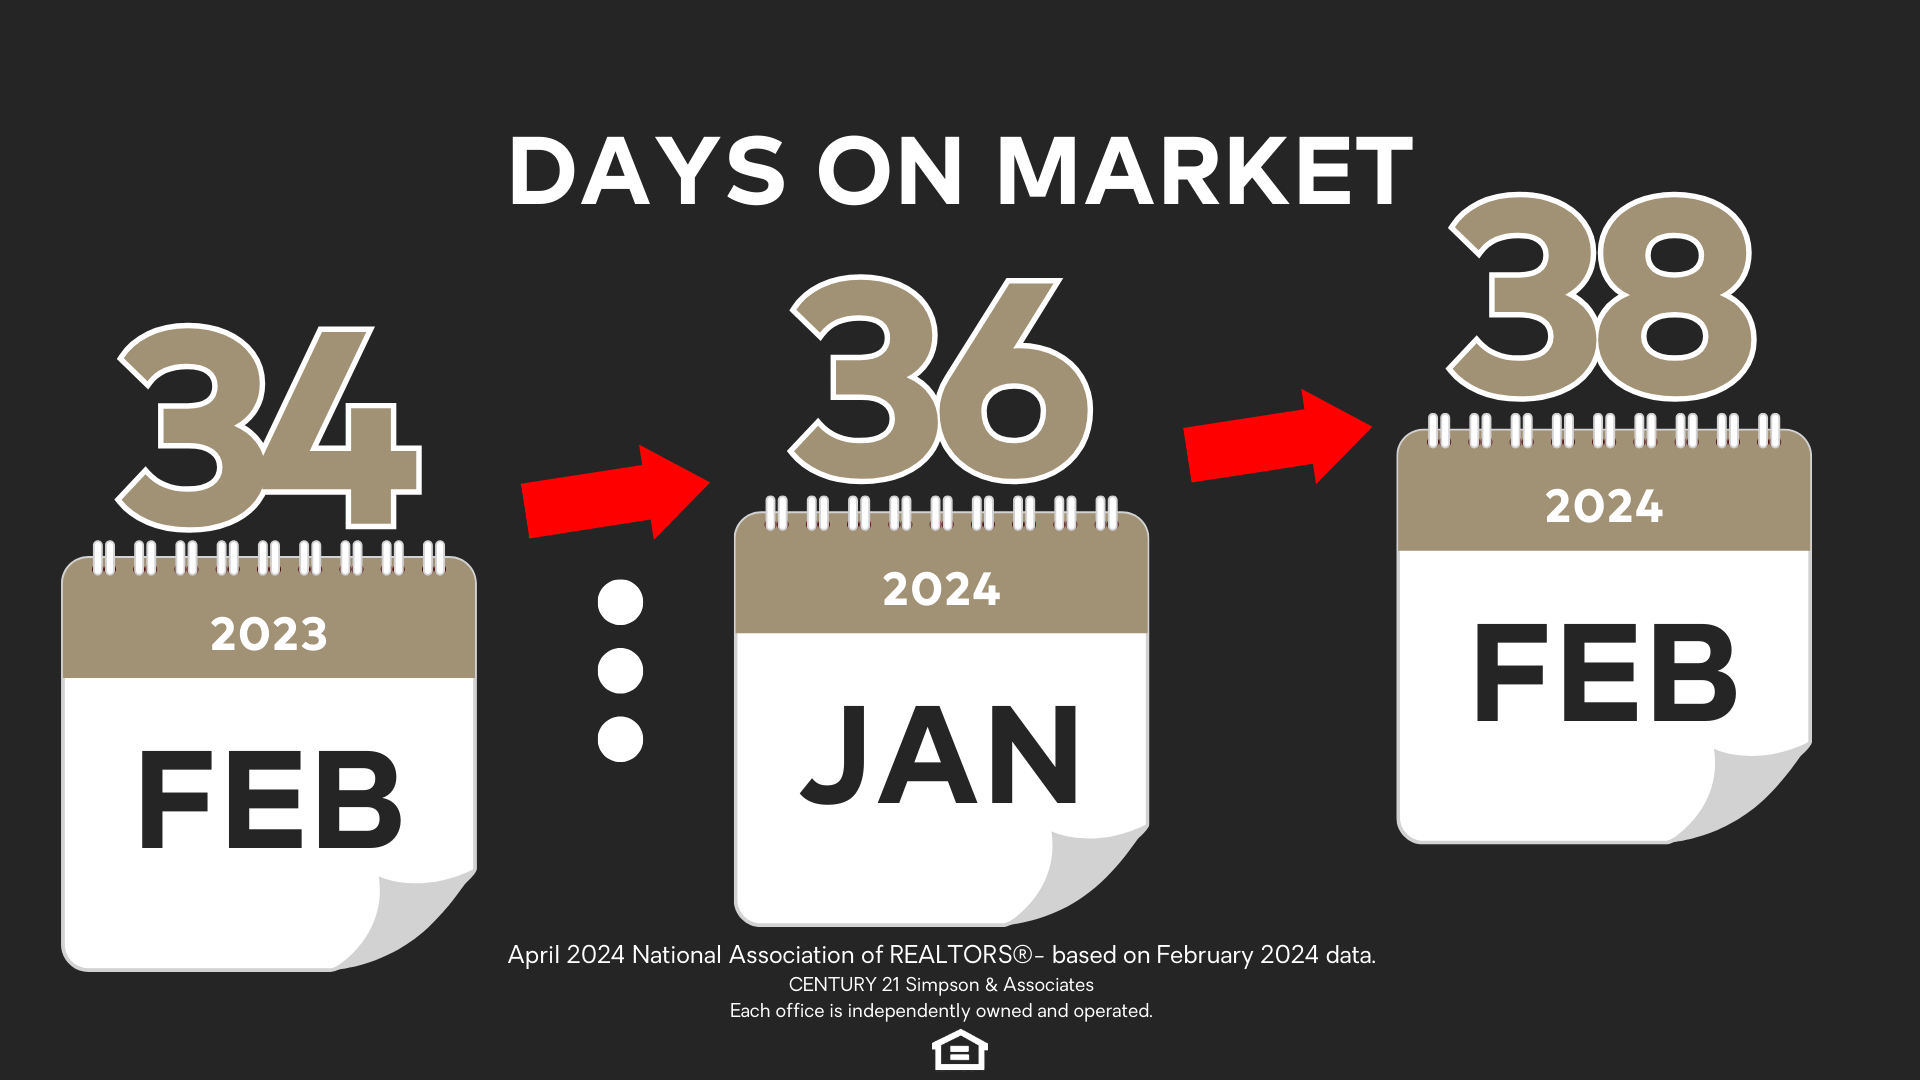
Days on Market was 38 days, up from 36 days in January and 34 days in February 2023.
Both the average number of offers and the percentage of home sold above list price are the same as last month and last year! Both are flat: The average number of offers per listing was 2.7 and 16% of homes sold above list price.
As rates fall and competition increases, more buyers could start acting fast.
Let’s recap what sellers need to know and summarize some actionable insights for anyone considering selling their home.
- Tight inventory continues to be a major factor fueling this market. With only a bit more than 1 million properties and 2.9 months of listings on the market, the market continues to strongly favor sellers.
- Prices in February were up 5.7% compared to last year. Tight inventory and strong buyer demand could lead to more price increases this year.
- Rates are still below the highs of last year. Buyers who were priced out of the market last year are expected to return—increasing competition.
- Homes were on the market for 38 days in February. As rates fall and competition increases, sellers can expect more buyers to act fast.
If you have a home to sell and were feeling like you missed your window, don’t miss this one.
At CENTURY 21 Simpson & Associates, we understand that the process of selling a home can be stressful and uncertain. If you are considering selling your home, let us, or have your REALTOR run the numbers based on the market and see if that achieves your financial goals.
Timing the market is nearly impossible! The best we can do is read and react to the data available, and it’s sending a clear message: If you’re ready to sell, it’s best to act now!
Call our Frankfort Office or reach out to one of our real estate agents if you have any questions about the current real estate market.
If you are interested in comparing the indicators in this national market watch with those of Central Kentucky counties, check out our local real estate market update videos for Frankfort-Franklin County, Lawrenceburg-Anderson County, and Versailles-Woodford County.