

 Facebook
 X
X
 Pinterest
 Copy Link

Attention Central Kentucky homeowners! Is now the time to sell your home? The short answer continues to be yes according to the 5 national real estate market indicators.
If you are sitting on the fence, wondering if now is the time to sell your home, stay with us as we provide you with actionable insights to guide your decision-making process.
Welcome to the National Real Estate Market Watch for June 2024 brought to you by CENTURY 21 Simpson & Associates.
Prefer a video format? Visit our YouTube Channel: https://www.youtube.com/@century21simpsonassociates
(Playlist: National Residential Real Estate Market Watch)
Let’s start with our first national real estate market indicator, the Months Supply of Inventory.
This indicator tells us the balance between supply and demand in the real estate market and whether the current market favors buyers or sellers.
Months Supply of Inventory is how long the current inventory of properties available for purchase would last at the current rate of sales.
Total housing inventory at the end of April was 1.21 million units, up 9% from March and 16.3% from one year ago when it was 1.04 million.
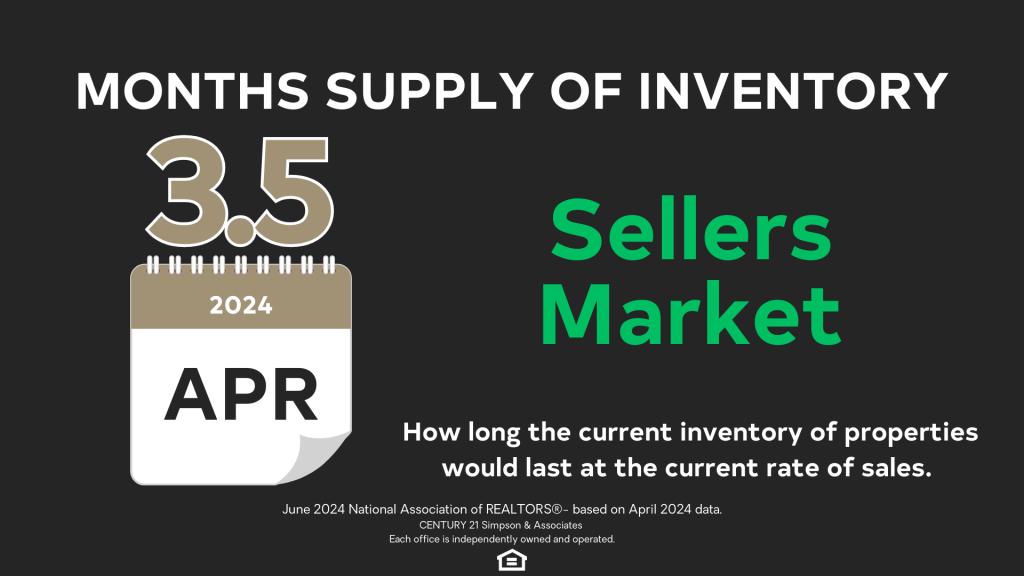
Unsold inventory sits at a 3.5-month supply at the current sales pace, up from 3.2 months in March and 3.0 months in April 2023. For homes priced $1 million or more, inventory and sales increased by 34% and 40%, respectively, from a year ago.
Six months of inventory represents a balanced market, favoring neither buyer nor seller. When Months Supply of Inventory is below 6 months, it is considered a sellers’ market.
The market continues to strongly favor sellers, giving them more negotiating power than buyers. With supply increasing, buyers benefit from a little more choice and time in the process.
Our second indicator is Existing Home Sales.
This indicator tells us about the pace of the market. A faster pace favors sellers.
Existing home sales is the total number of all the properties whose sales contracts were completed, or closed, during the month.
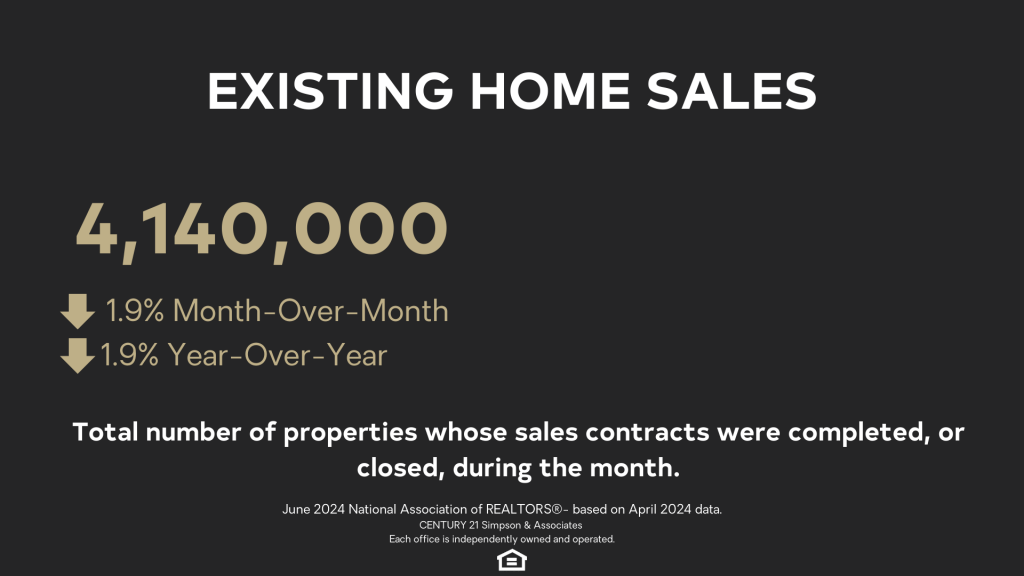
Existing-home sales faded 1.9% in April to a seasonally adjusted annual rate of 4.14 million—they are also down 1.9% from one year ago when it was 4.22 million in April 2023.
According to NATIONAL ASSOCIATION OF REALTORSÒ Chief Economist Lawrence Yun, “Home sales changed little overall, but the upper-end market is experiencing a sizable gain due to more supply coming onto the market.”
First-time buyers were responsible for 33% of sales in April, up from 32% in March and 29% in April 2023.
Sellers ready to list their homes should be encouraged because buyer demand still exceeds supply. As buyers accept the “new normal” for mortgage rates, they will re-enter the market creating more competition.
Next is the most-requested indicator, Median Sales Price.
This indicator helps us understand the core pricing trends of the market.
The median is the price where half of the homes sold in any given area that month were cheaper, and half were more expensive.
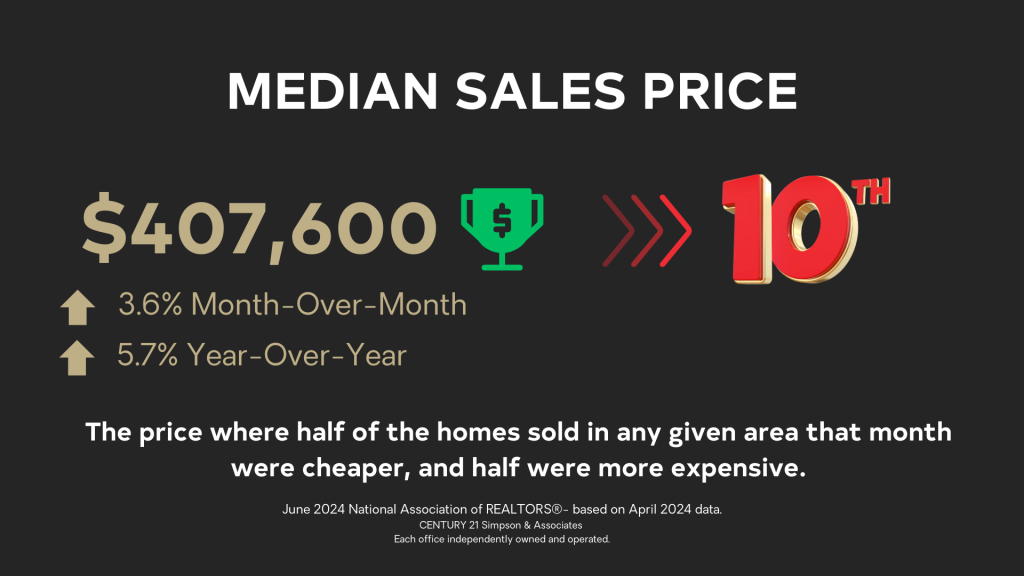
The median existing-home price in April was $407,600—another record high price and an increase of 5.7% from the previous year when it was $385,800. This is the 10th month in a row of year-over-year increases.
These sales are based on closings, so contracts were likely signed in February and March. Mortgage rates gradually increased in February and March before hitting above 7% mid-April.
According to NATIONAL ASSOCIATION OF REALTORSÒ Chief Economist Lawrence Yun, ”Home prices reaching a record high for the month of April is very good news for homeowners. However, the pace of price increases should taper off since more housing inventory is becoming available.”
Sellers still have an opportunity to capitalize on historically high prices and continued buyer demand. Buyers should consider locking in today’s prices—they may rise as more buyers re-enter the market.
Current Mortgage Rates
As a seller, mortgage interest rates are important because they determine the size of the pool of potential buyers and the speed of the selling process.
Mortgage interest rates vary by area, lender, and type of financing. For reference, we look at the national rate for a 30-year fixed-rate mortgage.
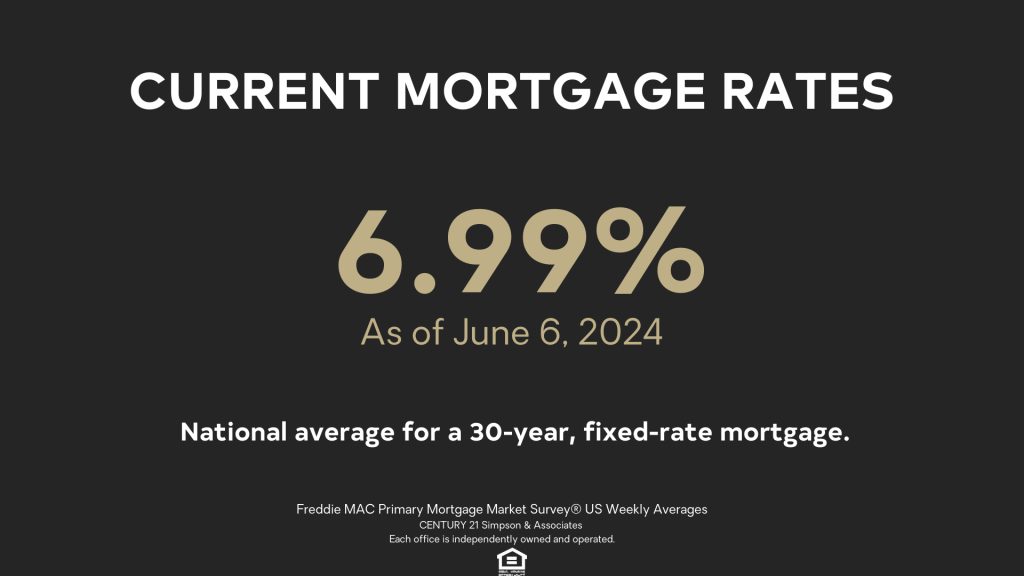
The 30-year fixed mortgage interest rate averaged 6.99% over the first week of June. At 6.99%, a mortgage payment on a $400,000 home with 10% down is $2,393 and $2,127 with 20% down.
According to Freddie Mac, mortgage rates retreated at the beginning of June given incoming data showing slower growth. Rates are just shy of seven percent, and we expect them to modestly decline over the remainder of 2024. If a potential buyer is looking to buy a home this year, waiting for lower rates may result in small savings, but shopping around for the best rate remains tremendously beneficial.
Jessica Lautz, Deputy Chief Economist and Vice President of Research at the NATIONAL ASSOCIATION OF REALTORSÒ said, “Real estate is local. A home buyer can improve their credit score, debt-to-income ratio, and lower an interest rate provided by the bank. Mortgage rates are one variable in a larger equation.“
Sellers should be encouraged that even though interest rates are pricing some buyers out of the market, demand still exceeds supply. Buyer affordability is strained with both higher rates and higher home values in this supply-constrained market.
Our final indicator is Days on Market.
The Days on Market indicator helps us determine if our pricing is correct or if there is some other market resistance, potentially leading to reduced buyer interest and negotiating power.
The Days on Market is the average number of days that sold listings were on the market. Those days are calculated from the day a property is listed until it goes under contract.
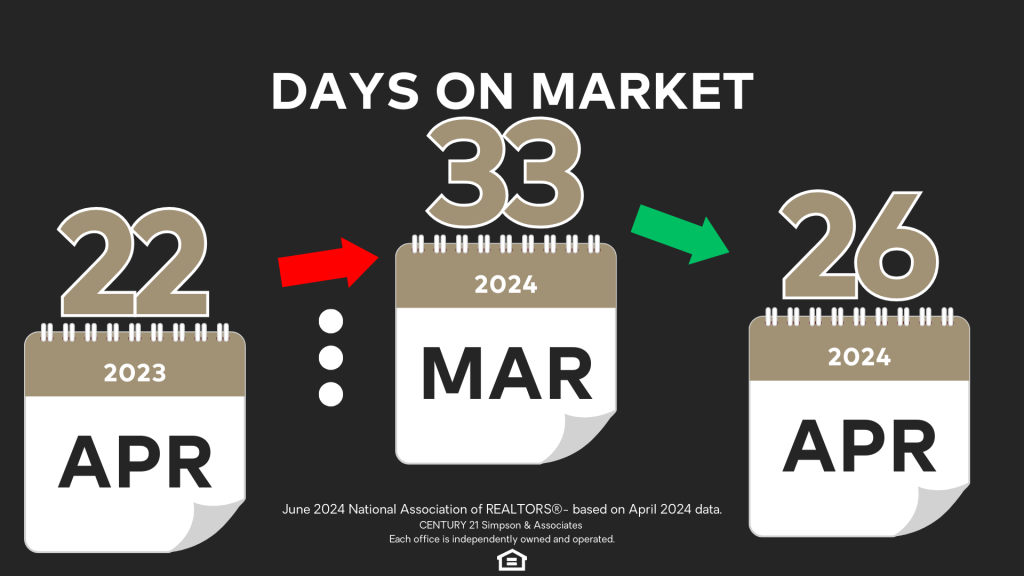
Properties typically remained on the market for 26 days in April, down from 33 days in March but up from 22 days in April 2023.
Homes listed received an average of 3.2 offers, up from 3.1 offers last month and from 3.1 offers one year ago.
With supply still limited relative to demand, 27% of homes sold above list price, down from 29% last month and 33% a year ago.
Sellers should be encouraged that as competition increases, more buyers could start acting fast. Increased competition means buyers will need to act fast and be ready with a strong offer.
Let’s recap what sellers need to know and summarize some actionable insights for anyone considering selling their home.
- Tight inventory continues to be a major factor fueling this market. With 1.21 million properties and 3.5 months of listings on the market, the market continues to strongly favor sellers.
- With fewer homes being sold, your property stands out more in the market, increasing its visibility to potential buyers
- Prices in April were up 5.7% compared to last year. Tight inventory and strong buyer demand could lead to more price increases this year.
- Rates are still below the historical average of 7.73%. Buyer demand indicates that buyers who can afford to buy are still in the market.
- Homes were on the market for 26 days in April. With supply still limited relative to demand, almost a third of homes sold above list price.
If you have a home to sell and were feeling like you missed your window, don’t miss this one.
At CENTURY 21 Simpson & Associates, we understand that the process of selling a home can be stressful and uncertain. If you are considering selling your home, let us run the numbers based on the market and see if that achieves your financial goals.
Timing the market is nearly impossible! The best we can do is read and react to the data available, and it’s sending a clear message: If you’re ready to sell, it’s best to act now!
Call our Frankfort Office or reach out to one of our real estate agents if you are interested in comparing the indicators in this national market watch with those of Central Kentucky counties or if you have any questions about the current real estate market.
Please join us again next month. Thanks for watching!


