
 Facebook
 X
X
 Pinterest
 Copy Link

Curious about the national residential real estate market?
We’ll discuss the six key national real estate market metrics and how each impacts buyers or sellers. Afterward, we’ll provide specific information for those who are considering buying or selling a home.
Prefer a video format? Visit our YouTube Channel: https://www.youtube.com/@century21simpsonassociates

Hello Central Kentucky. This is the National Real Estate Market Watch for December 2023 brought to you by CENTURY 21 Simpson & Associates. Let’s dive into the metrics and trends based on the latest national market data from October.
Months Supply of Inventory
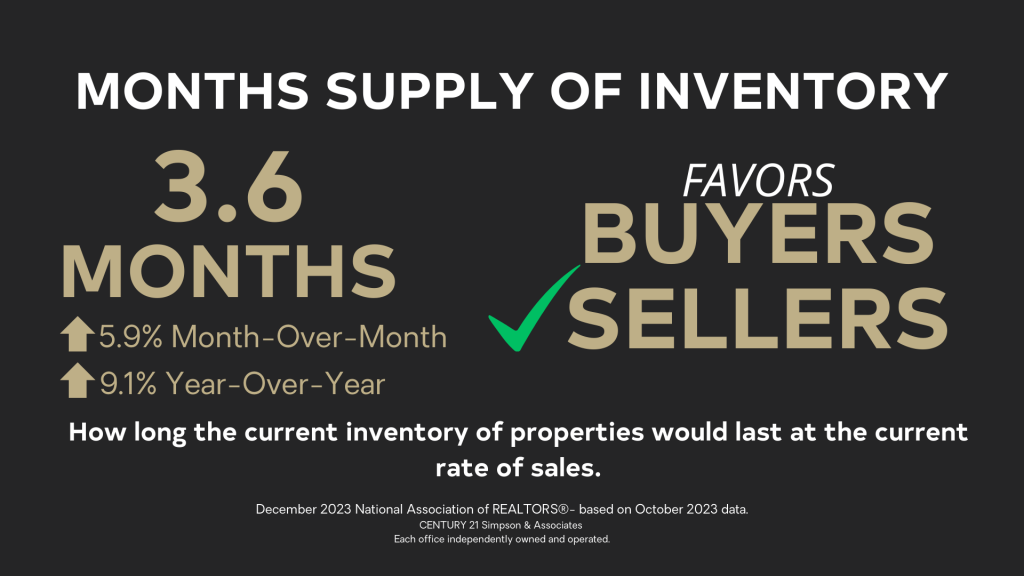
Months Supply of Inventory measures how long the current inventory of properties would last at the current rate of sales if no new properties came on the market.
Six months of inventory represents a balanced market, favoring neither buyer nor seller.
The number of homes on the market rose in October, marking the 18th consecutive month of year-over-year increases in months supply of inventory.
The months supply of inventory rose to 3.6 months. That’s a 5.9% increase over the previous month and 9.1% higher than a year ago.
Buyers have less competition compared to the recent past. However, competition remains resilient.
At 3.6 months supply of inventory, the market continues to favor sellers, which means there are not enough homes on the market to meet buyer demand. For context, over the past decade, the average months supply of inventory was 3.9 months.
Current Inventory
Current inventory reflects the number of active listings as of the 15th of the month. The number of actives is not static and depends on when the report is run. A trend upward or downward from month-to-month can be established by using the same day of every month.
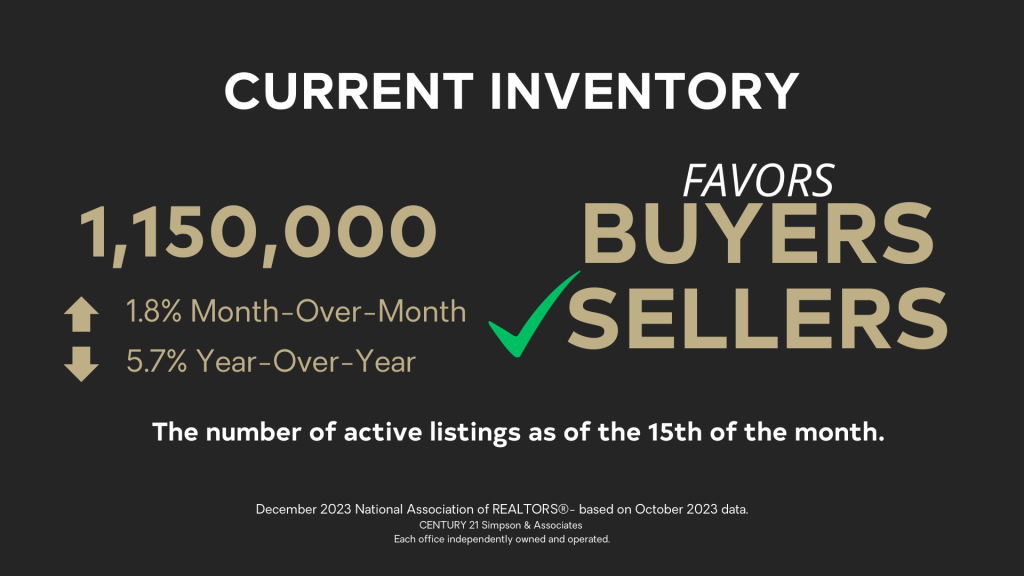
In October, the inventory of unsold existing homes rose to 1.15 million. That’s an increase of 1.8% compared to the previous month and down 5.7% compared to the previous year.
Only buyers who are not impacted by rising mortgage rates are likely to appreciate having slightly more options to choose from.
With the current low inventory, this metric favors Sellers. Sellers can feel more confident and may be more likely to put their home on the market despite rising mortgage rates.
Existing Home Sales Volume
The existing home sales volume is the total number of all the properties whose sales contracts were completed, or closed, during the month.
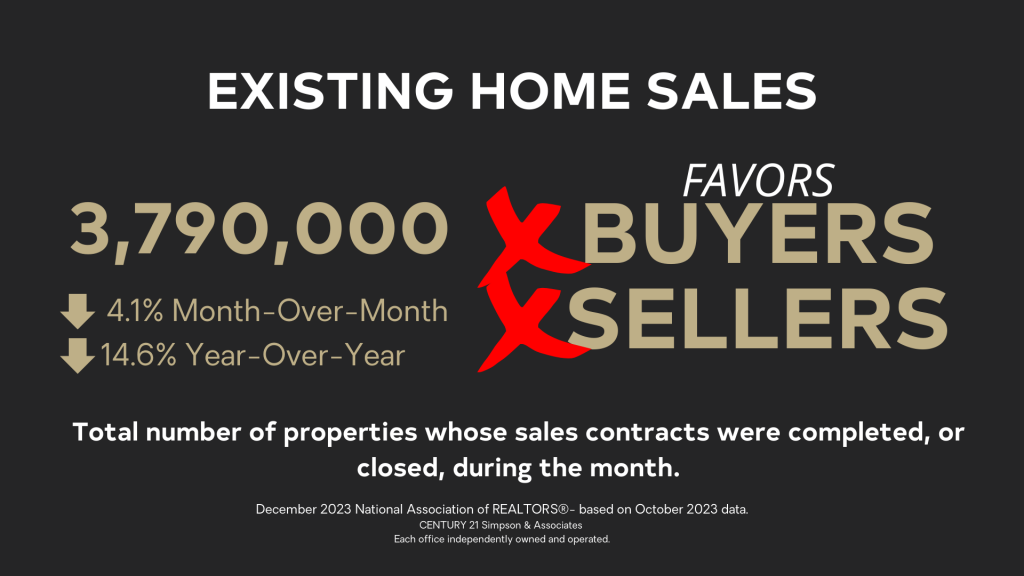
Home sales were down 4.1% compared to the previous month and 14.6% compared to the previous year.
“Prospective home buyers experienced another difficult month due to the persistent lack of housing inventory and the highest mortgage rates in a generation,” said National Association of REALTORS Chief Economist Lawrence Yun.
Homes that sold in October typically went under contract in September. In August, rates began jumping above 7%. As expected, we’re seeing a decline in sales as a result.
Buyer affordability is again impacted by higher interest rates. However, those who are willing or need to purchase can take advantage of a slight increase in inventory compared to the previous month.
Sellers who are ready to list their homes should be encouraged that despite sales being down, buyer demand continues to outpace supply.
While there are consequences for both buyers and sellers, the existing home sales metric is simply a gauge of market activity during this period and favors neither buyers nor sellers.
Median Sales Price
The median is the price where half of the homes sold in any given area that month were cheaper, and half were more expensive.
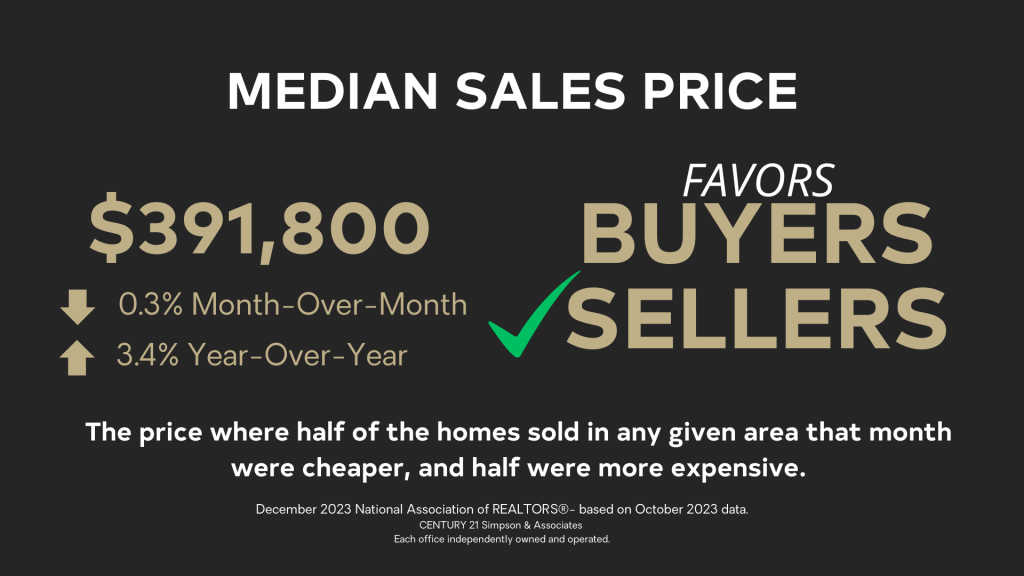
The median sales price fell 0.3% to $391,800 compared to last month yet it’s up 3.4% over last year.
Affordability has been dramatically impacted by the double hit of high prices and mortgage rates. It has challenged many buyers and would-be sellers that need to purchase again. There is still not enough inventory to meet demand – which means that prices will likely continue to rise year-over-year.
“While circumstances for buyers remain tight, home sellers have done well as prices continue to rise year-over-year, including a new all-time high for the month of October” said National Association of REALTORS Chief Economist Lawrence Yun. “In fact, a typical homeowner has accumulated more than $100,000 in housing wealth over the past three years.”
Buyers who are currently able to take advantage of the lower levels of competition can lock in today’s home prices and refinance their rate later.
Sellers can still capitalize on historically high prices and continued buyer demand.
Sales prices are directly related to the continued levels of low inventory so this metric favors sellers.
Current Mortgage Rates
Interest rates vary by area, lender, and type of financing. For reference, we look at the national rate for a 30-year fixed-rate mortgage.
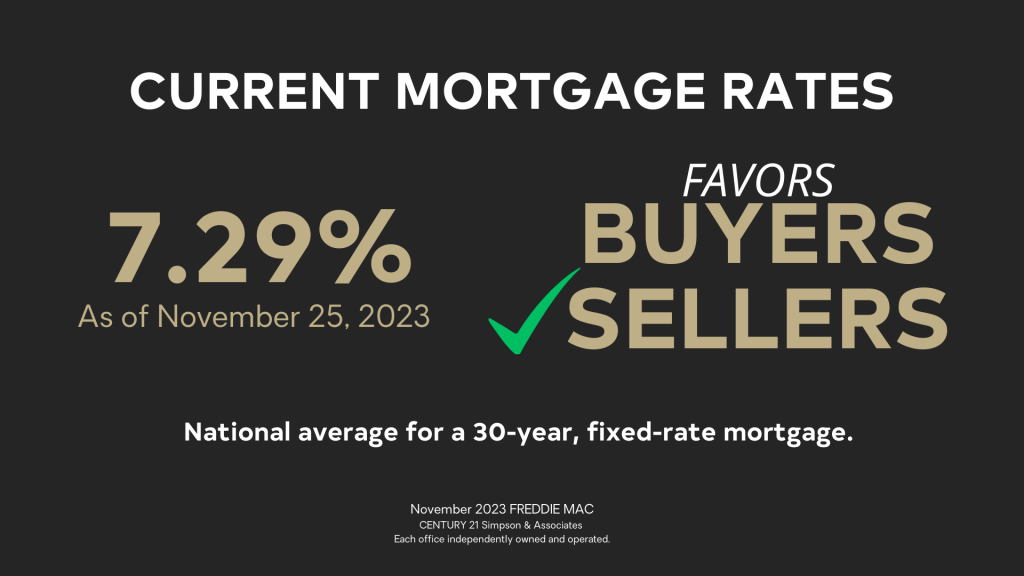
Interest rates are a big piece of the affordability equation for buyers. Each 1% increase in rates is roughly equivalent to paying a 10% higher price. In November, rates fell from 7.79% to 7.29% – this equates to paying about 5% less for the same property.
While the current interest rates feel high to consumers compared to the 2.65% rates they enjoyed not even three years ago, they’re below the all-time average of 7.39%.
Lower mortgage rates are encouraging to some buyers who had felt priced out of the market.
Buyers tend to resume their search when rates fall.
Thanks to continued strong prices and multiple offers, the rising mortgage rates won’t necessarily impact the sale of their home. Thus, this metric favors sellers.
Days on Market
The Days on Market is the average number of days that sold listings were on the market. Those days are calculated from the day a property is listed until it goes under contract. If there were any days the property was off the market, then those days are subtracted.

Days on Market are up by two days but are still moving at 23 days.
The average number of offers per listing was down slightly to 2.5 in October from 2.6 in September and 3.2 in August. In October, the number of listings that sold above asking rose to 28%. While that’s down from 31% in August, it’s up from 26% in September.
Yun points to the differences in the market within different price points as he says, “Multiple offers … are still occurring, especially on starter and mid-priced homes, even as price concessions are happening in the upper end of the market.”
For buyers, “hot” listings can still command top dollar – if a buyer has found “The One,” they have to be ready with a strong offer.
For sellers, despite rising days on market and a slight decline in offers, 28% of all listings still sold above the list price so this metric continues to favor sellers.
Now that we’ve covered the latest national housing market metrics, what do they mean for buyers and sellers? Let’s consider WHAT BUYERS AND SELLERS NEED to KNOW
BUYERS
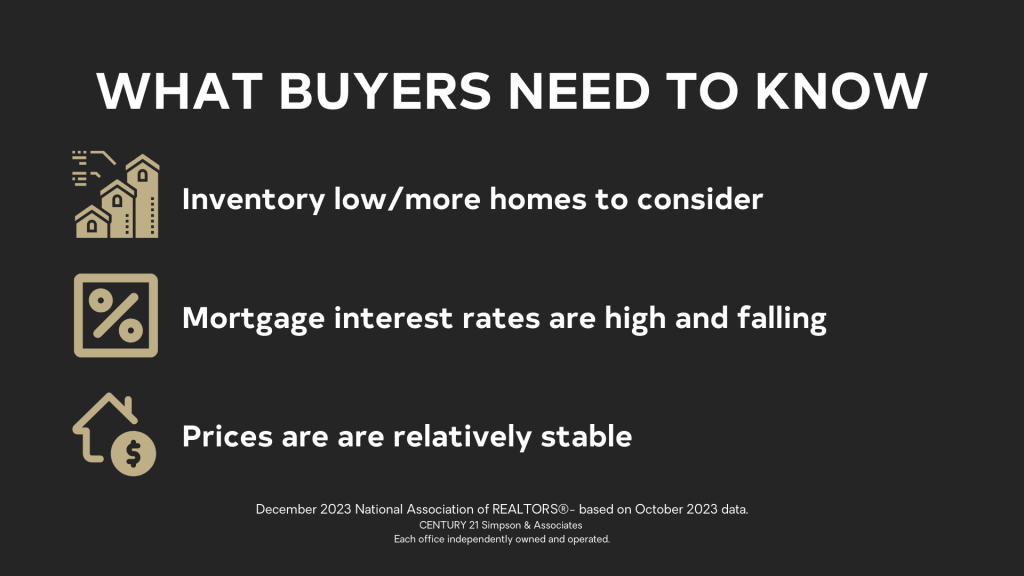
Great news! Inventory is up meaning you have less competition!
Rates have fallen from their high in October, giving your dollar a boost in terms of how much you can buy for the same payment.
When rates come down, buyers who have been waiting jump back in the market driving up competition and prices with multiple offers. You have the opportunity to act now and beat them to it!
Prices were relatively steady from the previous month. With low inventory and strong demand, it’s likely they’ll go higher. You have a unique opportunity to find a house and lock in today’s prices. You can always refinance as rates settle back down.
If you find the right house, wouldn’t it be great to make the move while all these factors are in your favor?
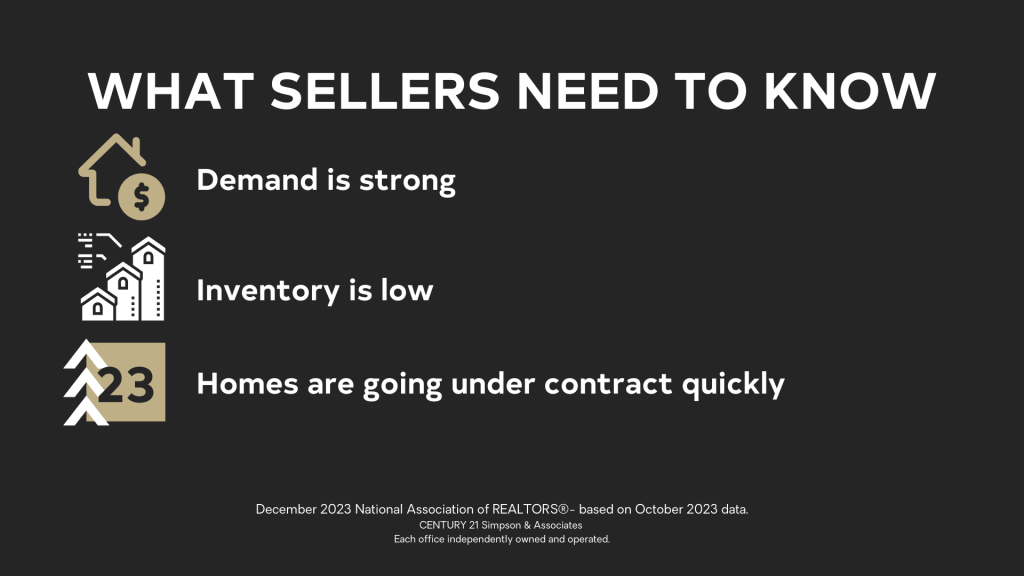
SELLERS
Timing the market is nearly impossible! The best we can do is read and react to the data available.
Although sales are down, signs point to strong conditions for sellers. Prices hit a new all-time high for the month of October and multiple offers persist!
Inventory remains low and homes are going under contract quickly
Have your REALTOR run the numbers based on the market and see if that achieves your financial goals. It’s best to act now if you’re ready to sell.
If you are interested in comparing the metrics in this national market update with those in Central Kentucky counties, check out our local real estate market updates for Frankfort-Franklin County, Georgetown-Scott County, Lawrenceburg-Anderson County, Lexington-Fayette County, Nicholasville-Jessamine County, and Versailles-Woodford County.
Have questions? Call our Frankfort or Lexington Offices or reach out to one of our real estate agents.