
 Facebook
 X
X
 Pinterest
 Copy Link
Attention Central Kentucky homeowners! Are you sitting on the fence, wondering if it’s the opportune moment to sell your home? Below, we’ll provide you with actionable insights to guide your decision-making process.
Prefer a video format? Visit our YouTube Channel: https://www.youtube.com/@century21simpsonassociates
(Playlist: National Residential Real Estate Market Watch)
Is now the time to sell your home? The short answer is yes.
Why? The national real estate market indicators have the answers.
Let’s start with the Months Supply of Inventory.
This indicator will tell us the balance between supply and demand in the real estate market and whether the current market favors buyers or sellers.
Over the past six months, the number of homes available for purchase has been relatively flat, ranging from 1 to 1.15 million.
Meanwhile, the months’ supply of inventory, indicating how long it takes to sell the current inventory at the current sales rate, has increased year-over-year for the past 20 months. This lift may feel like we are approaching “normal” as, for the past decade, the average months’ supply of inventory was 3.8 months.
Six months of inventory represents a balanced market, favoring neither buyer nor seller. When Months Supply of Inventory is below 6 months, it is considered a sellers’ market.
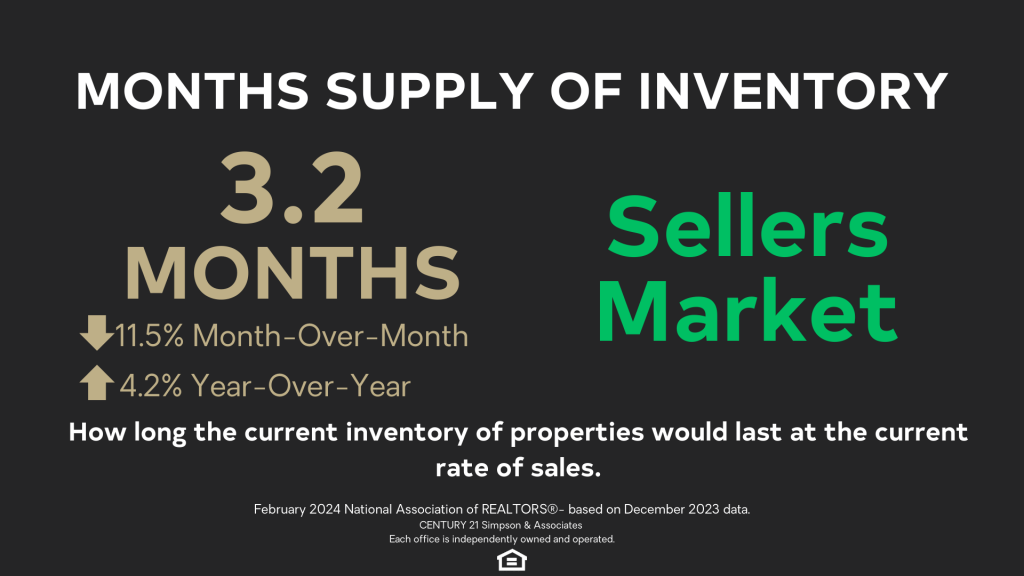
At 3.2 months’ supply of inventory, the market continues to favor sellers. There are not enough homes on the market to meet buyer demand.
Our second indicator is Existing Home Sales.
This indicator tells us about the pace of the market. A faster pace favors sellers.
Existing home sales is the total number of all the properties whose sales contracts were completed, or closed, during the month.
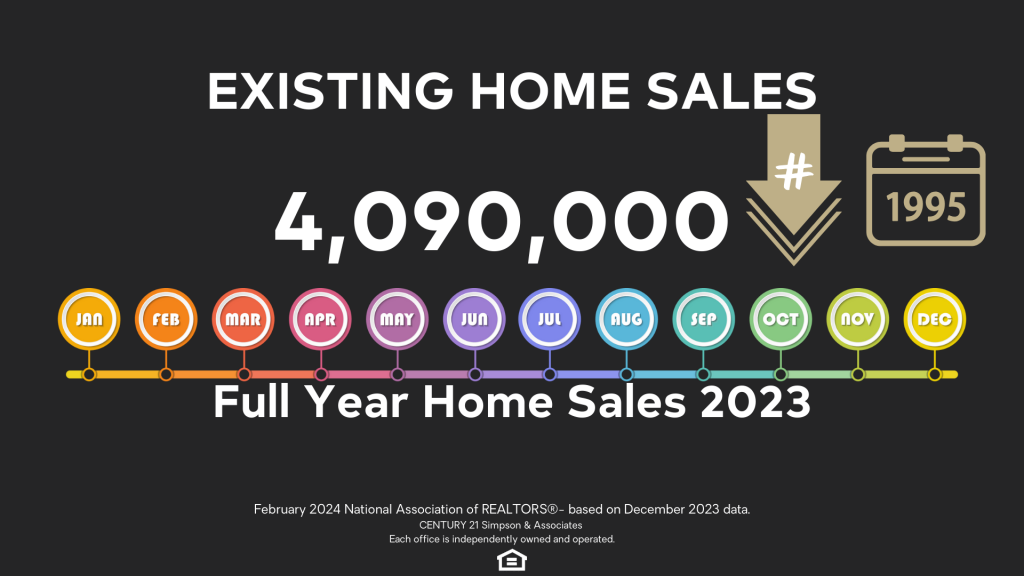
Home sales were down 1.0% compared to the previous month. Full-year home sales for 2023 came in at 4.09 million units, the lowest tally since 1995.
National Association of REALTORS Chief Economist Lawrence Yun said, “[December’s] sales look to be the bottom before inevitably turning higher in the new year. Mortgage rates are meaningfully lower compared to just two months ago, and more inventory is expected to appear on the market in upcoming months.”
Sellers ready to list their homes should be encouraged because, despite lower sales, buyer demand still exceeds supply.
As rates moderate, more buyers will re-enter the market creating more competition.
Next is the most-requested indicator, Median Sales Price.
This indicator helps us understand the core pricing trends of the market.
The median is the price where half of the homes sold in any given area that month were cheaper, and half were more expensive.
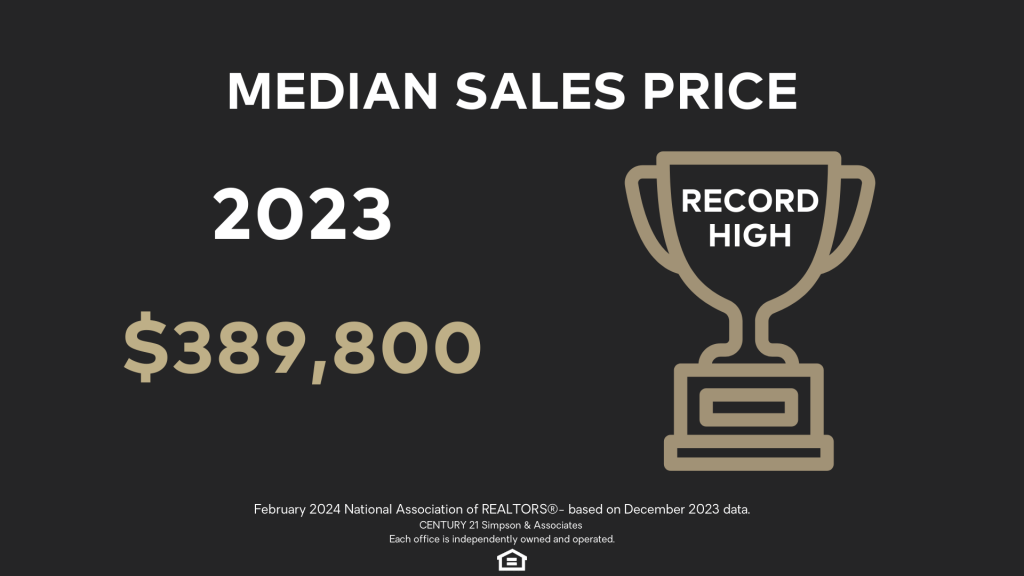
Tight supply continues to reheat home prices. December marks the sixth consecutive month of year-over-year price gains. The median price for the full year was $389,800, a record high.
Lawrence Yun, National Association of REALTORS Chief Economist said, “Despite sluggish home sales, 85 million homeowning households enjoyed further gains in housing wealth. Obviously, the recent, rapid three-year rise in home prices is unsustainable. If price increases continue at the current pace, the country could accelerate into haves and have-nots…It requires economic and income growth and, most importantly, a steady buildup of home construction.”
Sellers still have an opportunity to capitalize on historically high prices and continued buyer demand.
Current Mortgage Rates
As a seller, mortgage interest rates are important because they determine the size of the pool of potential buyers and the speed of the selling process.
Mortgage interest rates vary by area, lender, and type of financing. For reference, we look at the national rate for a 30-year fixed-rate mortgage.
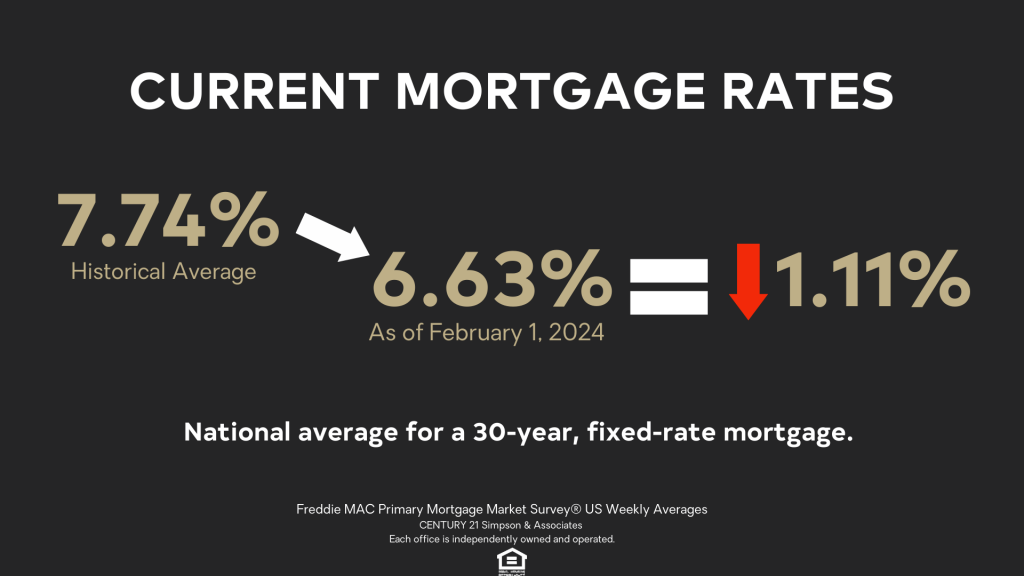
Mortgage rates decreased, reaching their lowest level since May of 2023 and a full point below the historical average of 7.74%, an encouraging development for the housing market and in particular first-time homebuyers who are sensitive to changes in housing affordability. However, as purchase demand continues to rise, it will put more pressure on already depleted inventory for sale.
Buyers who were priced out of the market last year are expected to return—increasing competition.
Our final indicator is Days on Market.
The Days on Market indicator helps us determine if our pricing is correct or if there is some other market resistance, potentially leading to reduced buyer interest and negotiating power.
The Days on Market is the average number of days that sold listings were on the market. Those days are calculated from the day a property is listed until it goes under contract.
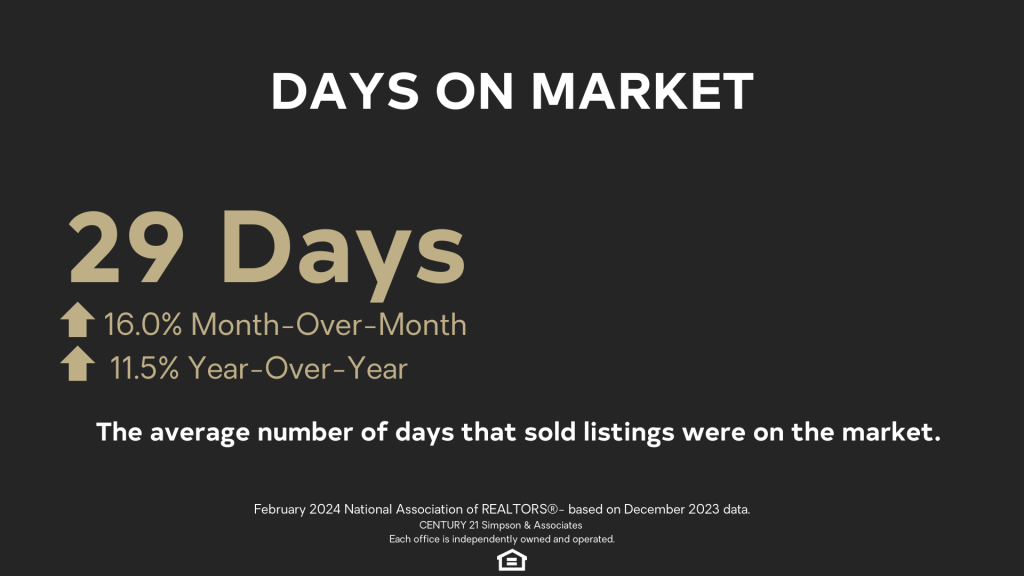
National Days on Market from December 2023
Days on Market was 29 days, up 4 days from last month’s data.
The average number of offers per listing was 2.4, down slightly from 2.6 offers [in November] and up slightly from 2.2 offers in December 2022.
With supply still limited relative to demand, 16% of homes sold above list price, down from 19% [in November] month and flat from 16% a year ago.
Affordability is impacting the first-time home buyer market—First-time buyers were responsible for 29% of sales in December, down from 31% in November 2023 and December 2022.
As rates fall and competition increases, sellers can expect more buyers to act fast and be ready with strong offers.
Let’s recap what sellers need to know and summarize some actionable insights for anyone considering selling their home.
- Prices in December were up 4.4% compared to last year. Tight inventory and strong buyer demand could lead to more price increases over time.
- Tight inventory continues to be a major factor fueling this market. With 1 million properties and 3.2 months of listings on the market, more buyers are expected to enter the market and prices are expected to rise further.
- Homes were on the market for 29 days in December. As rates fall and competition increases, sellers can expect more buyers to act fast.
- Rates are at their lowest level since May of 2023. Buyers who were priced out of the market last year are expected to return—increasing competition.
If you have a home to sell and were feeling like you missed your window, don’t miss this one.
At CENTURY 21 Simpson & Associates, we understand that the process of selling a home can be stressful and uncertain. If you are considering selling your home, let us or have your REALTOR run the numbers based on the market and see if that achieves your financial goals.
Timing the market is nearly impossible! The best we can do is read and react to the data available, and it’s sending a clear message: If you’re ready to sell, it’s best to act now!
Call our Frankfort Office or reach out to one of our real estate agents if you have any questions about the current real estate market.
If you are interested in comparing the indicators in this national market update with those of Central Kentucky counties, check out our local real estate market update videos for Frankfort-Franklin County, Lawrenceburg-Anderson County, and Versailles-Woodford County.
To watch our local updates, visit the Playlists on our YouTube Channel: https://www.youtube.com/@century21simpsonassociates