
 Facebook
 X
X
 Pinterest
 Copy Link
Attention, Central Kentucky homeowners! Are you sitting on the fence, wondering if it’s the opportune moment to sell your home? Stay with us as we provide you with actionable insights to guide your decision-making process.
This is the National Real Estate Market Watch for March 2024 brought to you by CENTURY 21 Simpson & Associates.
Prefer a video format? Visit our YouTube Channel: https://www.youtube.com/@century21simpsonassociates
(Playlist: National Residential Real Estate Market Watch)
Is now the time to sell your home? The short answer is yes. Why? The national real estate market indicators have the answers.
Let’s start with the Months Supply of Inventory.
This indicator will tell us the balance between supply and demand in the real estate market and whether the current market favors buyers or sellers. Over the past seven months, the number of homes available for purchase has been relatively flat, ranging from 1 to 1.15 million but up from one year ago when inventory was 980,000.
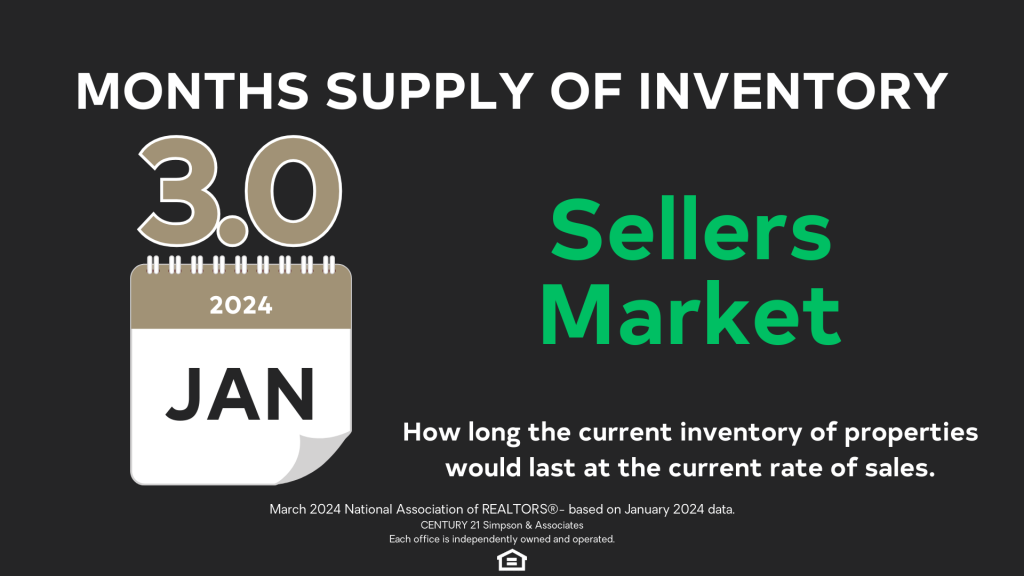
Meanwhile, the months’ supply of inventory, indicating how long it takes to sell the current inventory at the current sales rate, sits at a 3.0-month supply at the current sales pace, down from 3.1 months in December but up from 2.9 months in January 2023.
Six months of inventory represents a balanced market, favoring neither buyer nor seller. When Months Supply of Inventory is below 6 months, it is considered a sellers’ market. For context, over the past decade, the average months’ supply of inventory was 3.8 months, however at 3.0 months’ supply of inventory the market continues to favor sellers which means there are not enough homes on the market to meet buyer demand and that sellers have more negotiating power than buyers.
Our second indicator is Existing Home Sales.
This indicator tells us about the pace of the market. A faster pace favors sellers. Existing home sales is the total number of all the properties whose sales contracts were completed, or closed, during the month.
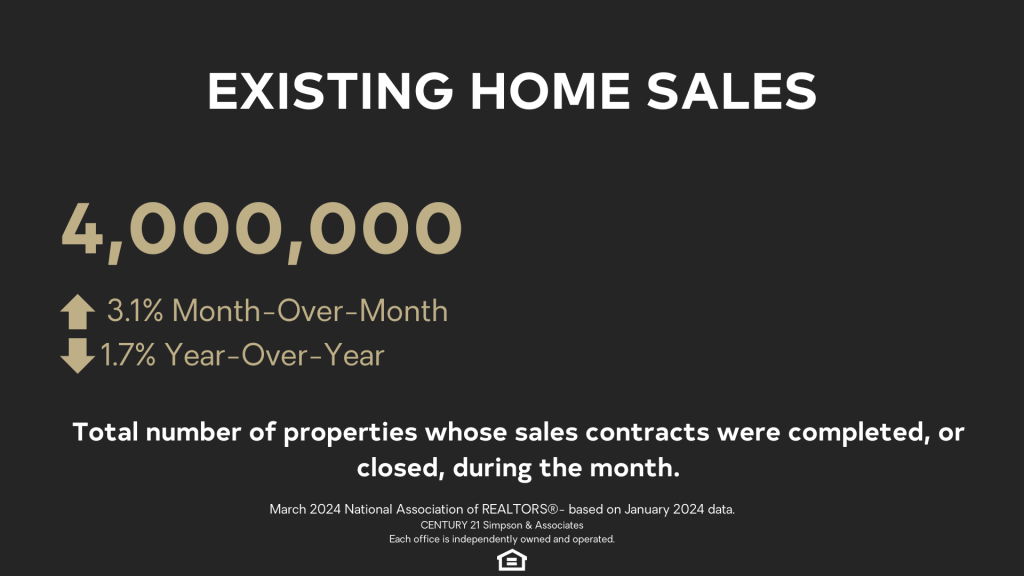
Home sales were up 3.1% compared to the previous month. Year-over-year, sales slipped 1.7%—down from 4.07 million in January 2023.
According to National Association of REALTORS Chief Economist Lawrence Yun, “While home sales remain sizably lower than a couple of years ago, January’s monthly gain is the start of more supply and demand. Listings were modestly higher, and home buyers are taking advantage of lower mortgage rates compared to late last year.” Sellers ready to list their homes should be encouraged because buyer demand still exceeds supply. As rates moderate, more buyers will re-enter the market creating more competition.
Next is the most-requested indicator, Median Sales Price.
This indicator helps us understand the core pricing trends of the market. The median is the price where half of the homes sold in any given area that month were cheaper, and half were more expensive.
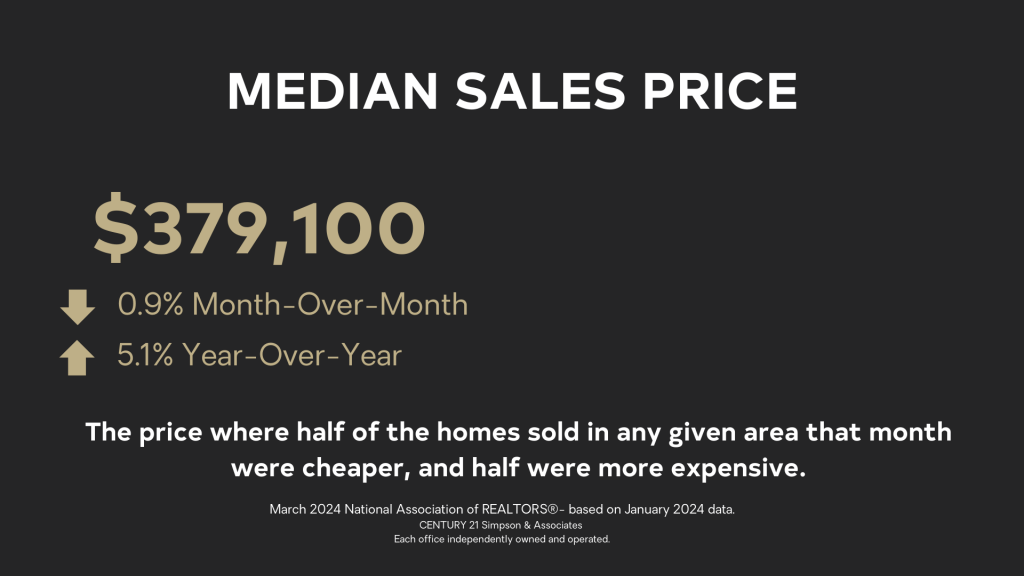
The median home price in January was $379,100, an increase of 5.1% from one year ago when it was $360,800.
Lawrence Yun, National Association of REALTORS Chief Economist said, “The median home price reached an all-time high for the month of January. Multiple offers are common on mid-priced homes, and many homes were still sold within a month. The elevated share of cash deals – 32% – indicated a market full of multiple offers and propelled by record-high housing wealth.” Sellers still have an opportunity to capitalize on historically high prices and continued buyer demand.
Current Mortgage Rates
As a seller, mortgage interest rates are important because they determine the size of the pool of potential buyers and the speed of the selling process. Mortgage interest rates vary by area, lender, and type of financing. For reference, we look at the national rate for a 30-year fixed-rate mortgage. Strong economic and inflation data has caused the Fed to reconsider cutting interest rates right away.
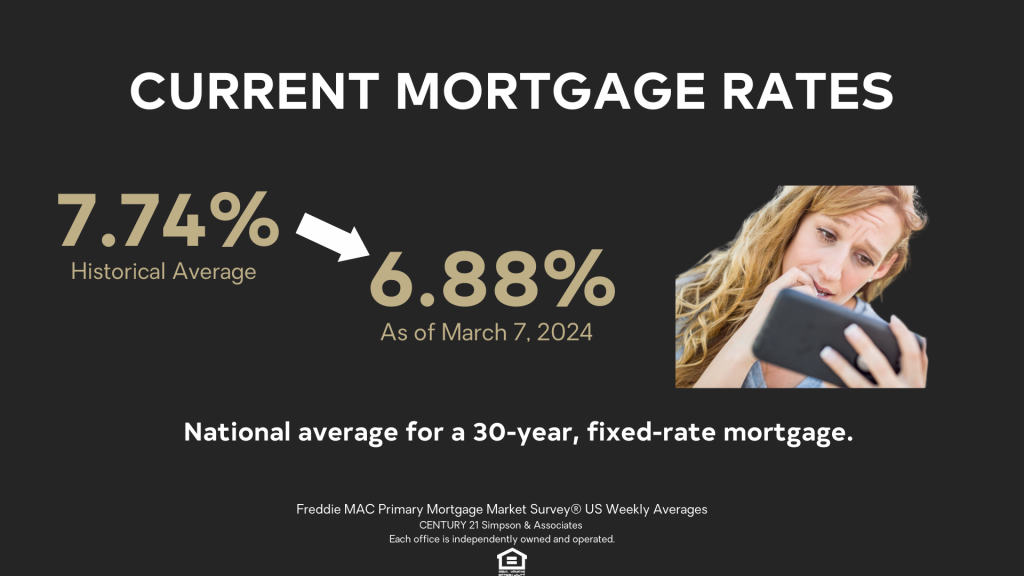
Mortgage rates dipped down to 6.88% the week ending March 7th from 6.94% the week before.
Even though this is still below the historical average of 7.74% and the rates seen in the fall of 2023, it impacts home buyers’ excitement about entering a spring market. Jessica Lautz, National Association of REALTORS Deputy Chief Economist and Vice President of Research says, “While mortgage interest rates may come down to the low 6% range in the middle to later part of the year, buyers must weigh what makes the most sense for them as home prices are expected to climb due to limited inventory. Timing the real estate market based purely on mortgage interest rates, especially marginal changes, rarely works when new babies, marriages, and jobs are the real decision-makers.” Buyers who are priced out of the market may sit on the sideline and wait for rates to fall.
Our final indicator is Days on Market.
The Days on Market indicator helps us determine if our pricing is correct or if there is some other market resistance, potentially leading to reduced buyer interest and negotiating power. The Days on Market is the average number of days that sold listings were on the market. Those days are calculated from the day a property is listed until it goes under contract.
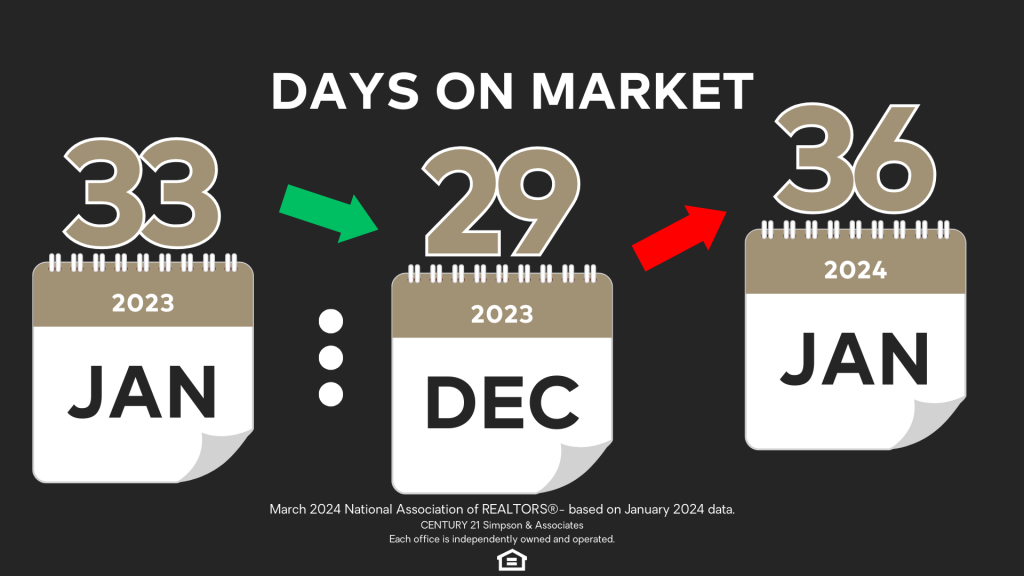
Days on Market was 36 days, up from 29 days in December and 33 days in January 2023. The average number of offers per listing was 2.7, up slightly from 2.4 offers last month and up slightly from 2.5 offers in January 2023. With supply still limited relative to demand, 16% of homes sold above list price flat from last month and a year ago. Affordability is still impacting the first-time home buyer market—First-time buyers represented 28% of buyers, down from 31% last month and 29% a year ago. As rates fall and competition increases, more buyers could start acting fast.
Let’s recap what sellers need to know and summarize some actionable insights for anyone considering selling their home.
- Tight inventory continues to be a major factor fueling this market. With around 1 million properties and 3.0 months of listings on the market, the market continues to strongly favor sellers.
- Home sales were up 3.1% in January compared to the previous month. Sellers ready to list their homes should be encouraged because despite more sales, buyer demand still exceeds supply.
- Prices in January were up 5.1% compared to last year. Tight inventory and strong buyer demand could lead to more price increases over time.
- With interest rates just below 7%, buyers who are priced out of the market may sit on the sideline and wait for rates to fall.
- Homes were on the market for 36 days in January. As rates fall and competition increases, more buyers could start acting fast.
If you have a home to sell and were feeling like you missed your window, don’t miss this one.
At CENTURY 21 Simpson & Associates, we understand that the process of selling a home can be stressful and uncertain. If you are considering selling your home, let us or have your REALTOR run the numbers based on the market and see if that achieves your financial goals. Timing the market is nearly impossible! The best we can do is read and react to the data available, and it’s sending a clear message: If you’re ready to sell, it’s best to act now!
Call our Frankfort Office or reach out to one of our real estate agents if you have any questions about the current real estate market.
If you are interested in comparing the indicators in this national market watch with those of Central Kentucky counties, check out our local real estate market update videos for Frankfort-Franklin County, Lawrenceburg-Anderson County, and Versailles-Woodford County.