Facebook
 Twitter
 Pinterest
 Copy Link
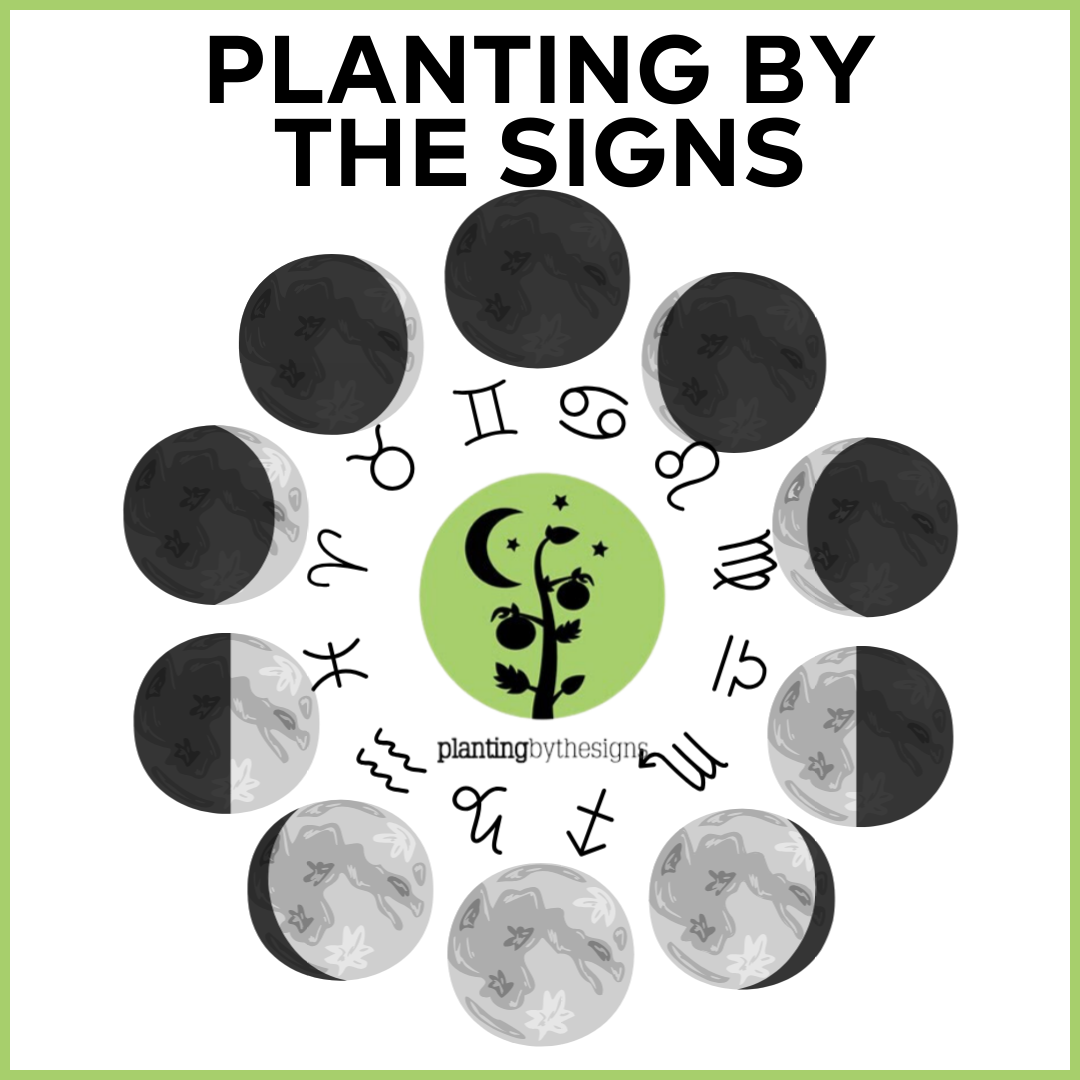
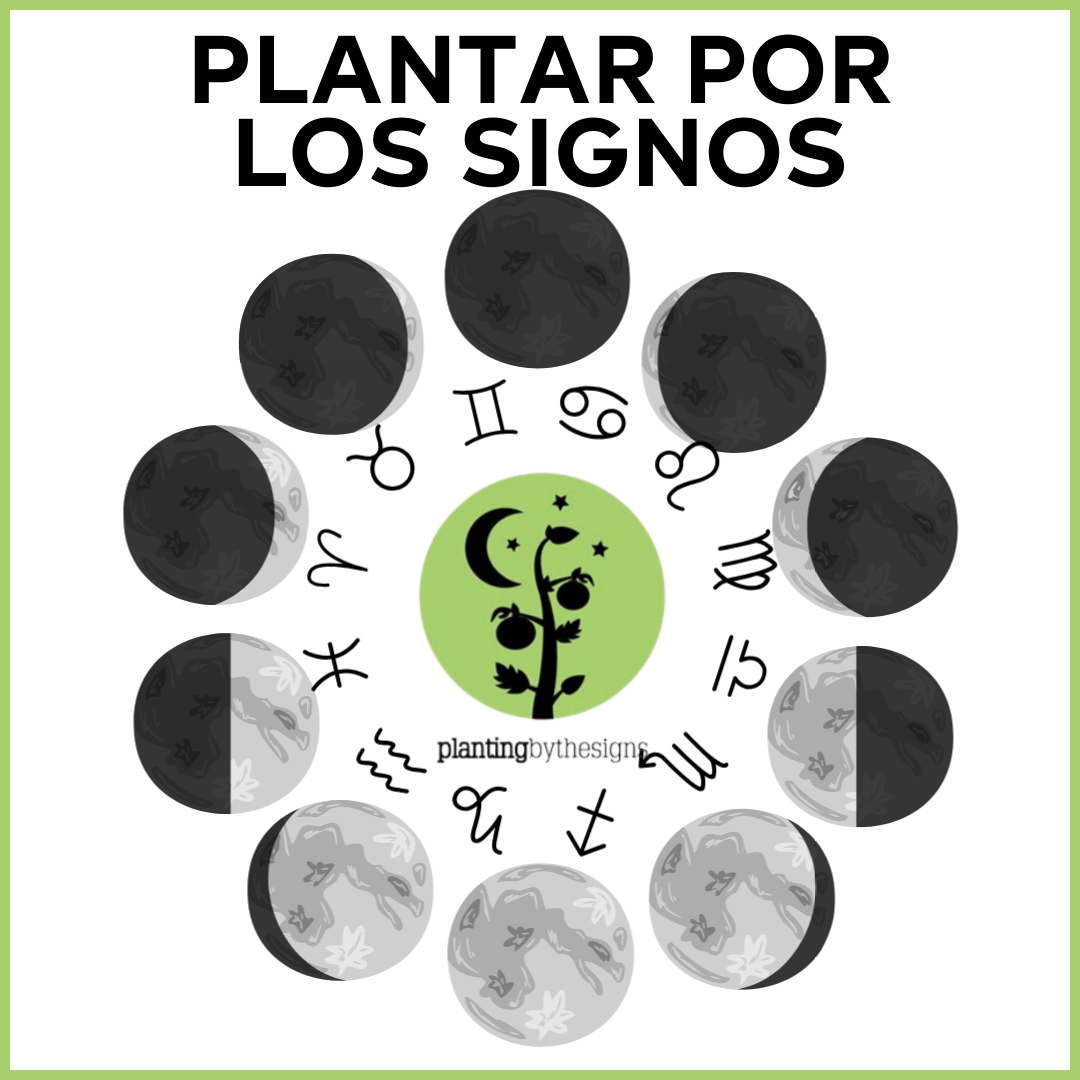
![Planting by the Signs [Plantar por los signos]- Phil Case](https://century21simpson.com/files/2023/12/Planting-by-the-Signs-Phil-Case.png) PBTS NOTE: At the bottom of this column, you will find: 1) information reviewing the best days this month for seeding above-ground producers to grow your own transplants. 2) Also, there are 17 an incredible 17 days across March into April for making changes; 3) and when to pour gravel. But first, the March Overview. Remember all times are EST until March 10 when Daylight Saving Time returns. Now, Quick Takes to clip and put up on the fridge!
PBTS NOTE: At the bottom of this column, you will find: 1) information reviewing the best days this month for seeding above-ground producers to grow your own transplants. 2) Also, there are 17 an incredible 17 days across March into April for making changes; 3) and when to pour gravel. But first, the March Overview. Remember all times are EST until March 10 when Daylight Saving Time returns. Now, Quick Takes to clip and put up on the fridge!
QUICK TAKES
March 2-7: Fertile, Sagittarius/thighs, Capricorn/knees, Aquarius/legs, dark moon, below-grounders
MAKE CHANGES: March 2-9, dark moon/signs perfect, more below
March 8-9: VERY fertile, Pisces/feet, dark moon, below-grounders
March 10: Daylight Saving Time begins, 2 a.m.; moon moves to light phase, 5 a.m.
March 10-11: NO PLANTING, killing sign, Aries/head
March 12-13: VERY fertile, Taurus/neck, light moon, above-grounders
March 14-16: Pea sign – Gemini/arms, light moon
March 17-18: VERY FERTILE, Cancer/breast, above-grounders
March 19-21: NO PLANTING, Leo/heart, killing sign
March 22-26: Flowering signs – Virgo/bowels, Libra/reins, no veggies
March 25: FULL/DARK MOON, 3 a.m., below-grounders through April 7
March 27-28: VERY fertile, Scorpio/secrets, dark moon, below-grounders
March 29-31: Fertile, Sagittarius/thighs, dark moon, below-grounders
MAKE CHANGES: March 29-April 6, dark moon/signs perfect.
MARCH OVERVIEW
MOON PHASES: March began and ends with the moon in the dark phase. It moves from dark to light with the new moon – or no moon visible in the sky – at 5 a.m. EDT on March 10 – the same morning Daylight Saving Time begins at 2 a.m. – and then back to the dark phase with the full moon at 3 a.m. on March 25.
When the light moon is in force (all but five hours of March 10 through March 24) plant above-ground producers and it’s below-ground producers when the dark moon rules, which is through March 9, returning for all but three hours of March 25 until 2:21 p.m. on April 8.
Don’t plant when either of the killing signs, Aries and Leo, are in force or veggies when the flowering signs Virgo and Libra rule.
Planting when the fertile signs rule is a viable alternative to the VERY fertile signs, which are Scorpio, Pisces, Taurus, and Cancer. The fertile ones – just a little below VERY fertile – are Sagittarius, Capricorn, and Aquarius.
If you can only utilize one aspect of the system for planting, I would suggest going with the moon phases but still avoid the killing signs Aries and Leo and the flowering signs Virgo and Libra for anything but flowers.
THE SIGNS: Check to see if the moon is in the light or dark phase (information above and on any calendar) before proceeding with planting anywhere, or other moon-related activities.
VERY FERTILE DAYS: These signs are accompanied by the phase of the moon in which they occur. Pisces (the feet), March 8-9, dark moon; Taurus (the neck), March 12-13, light moon; Cancer (the breast), March 17-18, light moon; and Scorpio (the secrets), March 27-28, all dark moon; There are eight days remaining in March ruled by the very fertile signs, down from 12 in February. Four find the dark moon ruling and four under the influence of the light moon. March 1 was a very fertile day, too, with Scorpio/ruling.
FERTILE DAYS (formerly called “so-so days”): Sagittarius (the thighs), March 2-3, 29-31; Capricorn (the knees), March 4-5; Aquarius (the legs), March 6-7. There nine days ruled by these three signs, up from six in February. The dark moon for below-ground producers rules all of them.
KILLING DAYS: No planting, transplanting, seeding, re-potting or dealing with things you want to thrive should occur on these days. Reserve them for anything but planting anywhere. No planting! Here’s when they rule: Aries (the head) March 10-11; Leo (the heart), March 19-21. That makes five days in March ruled by these two signs.
PEA/BEAN DAYS: Gemini (the arms), the pea/bean sign, rules March 14-16. The light moon rules all three days. You are clear to plant snow peas now but it’s too early for Southern peas, snap or pole beans since they can’t tolerate frost or freezing weather
FLOWERING DAYS: March 22-26, Virgo (bowels, two days) and Libra (reins, three). No veggies on flowering days – not many flowers yet either, unless perhaps some pansies! But it won’t be long.
CHANGES, SEEDING, GRAVEL
MAKING CHANGES: This month we are experiencing a huge bump in the number of days suited for making changes with the moon in the dark phase and the signs going out of the body beyond anything that functions. There are an incredible 11 in March and six more extending into April, up from six and a piece in February and they are in two stretches: March 2-8, and March 29-April 6.
Changes might include starting a diet or exercise program, stopping smoking or other unhealthy habits, weaning small children or animals, scheduling elective surgery or dental work – anything requiring doing something differently from the way you are doing it now.
The signs involved are Sagittarius/thighs, Capricorn/knees, Aquarius/legs, and Pisces/feet. See how they are moving down the body beyond “parts” that function like the heart or bowels.
THE BEST DAYS for seeding above-ground producers for your early summer garden this month are March 12-13, Taurus/neck; and March 17-18, Cancer/breast. The moon is in the light phase and these two signs are VERY fertile. Read more about seeding for your own transplants in last week’s paper.
POURING GRAVEL: If you have gravel to pour on a drive or road on your farm, do that when the light moon rules, which is March 10 through March 24, the moon moving to the dark phase on March 25 at 3 a.m.
The same applies for stones on a garden path: Place them when the moon is in the light phase, so they don’t sink. If you’re setting fence posts, do that in the light phase of the moon so the posts don’t sink.