Facebook
 Twitter
 Pinterest
 Copy Link

Is now the time to sell your home? Let’s find out!
Hello Frankfort, Kentucky. This is your Real Estate Market Watch for December 2023 brought to you by CENTURY 21 Simpson & Associates.
Prefer a video format? Visit our YouTube Channel: https://www.youtube.com/@century21simpsonassociates
Let’s recap the 2023 real estate market.
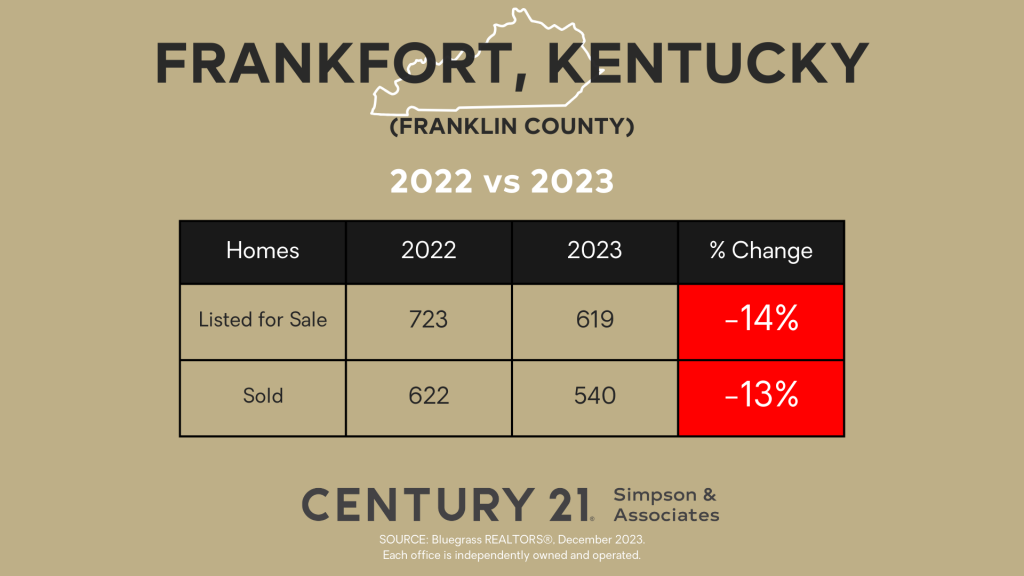
How did 2023 compare with 2022? 14% fewer homes came on the market in 2023. With fewer homes on the market, the number of homes sold dropped by 13%.
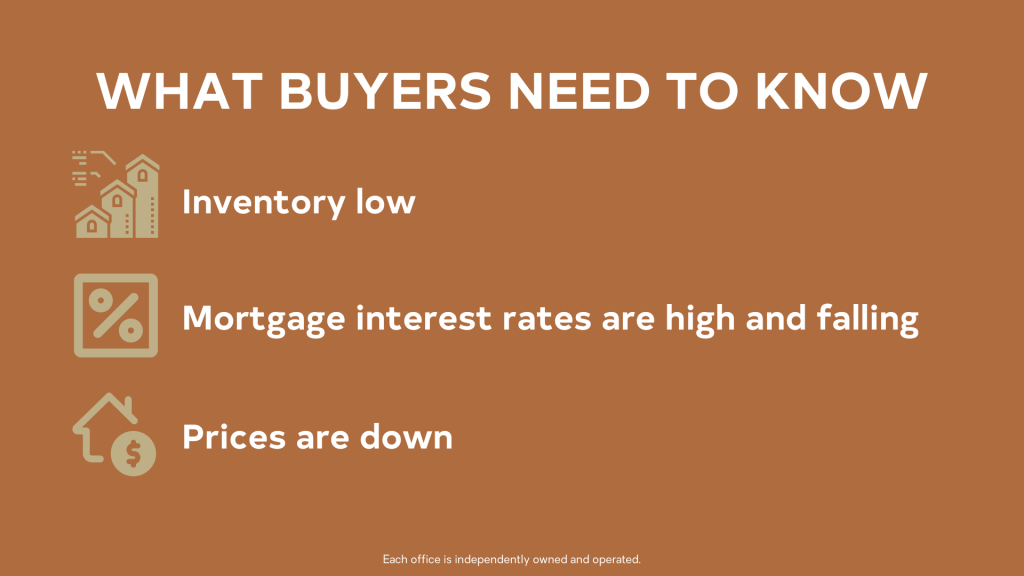
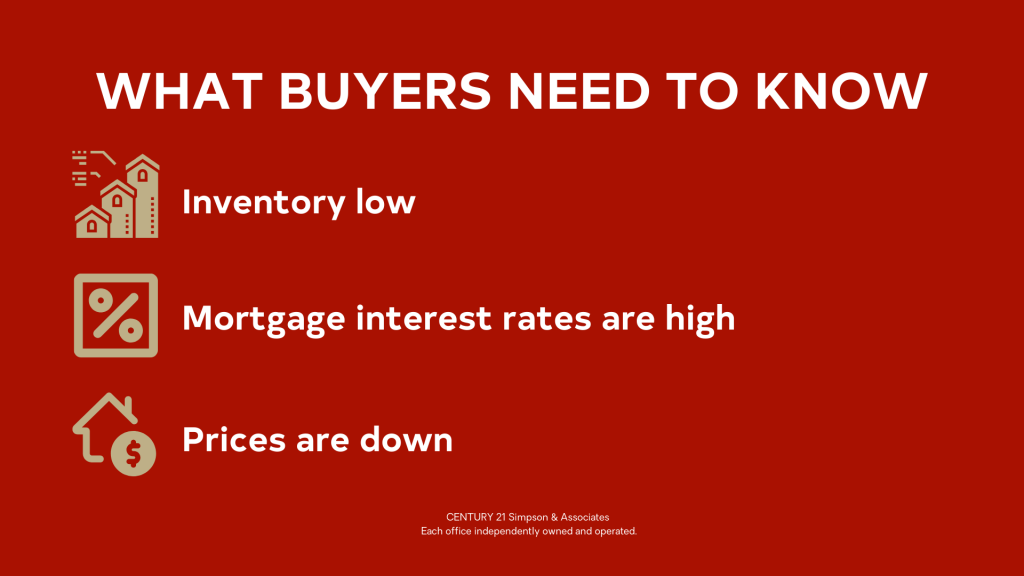
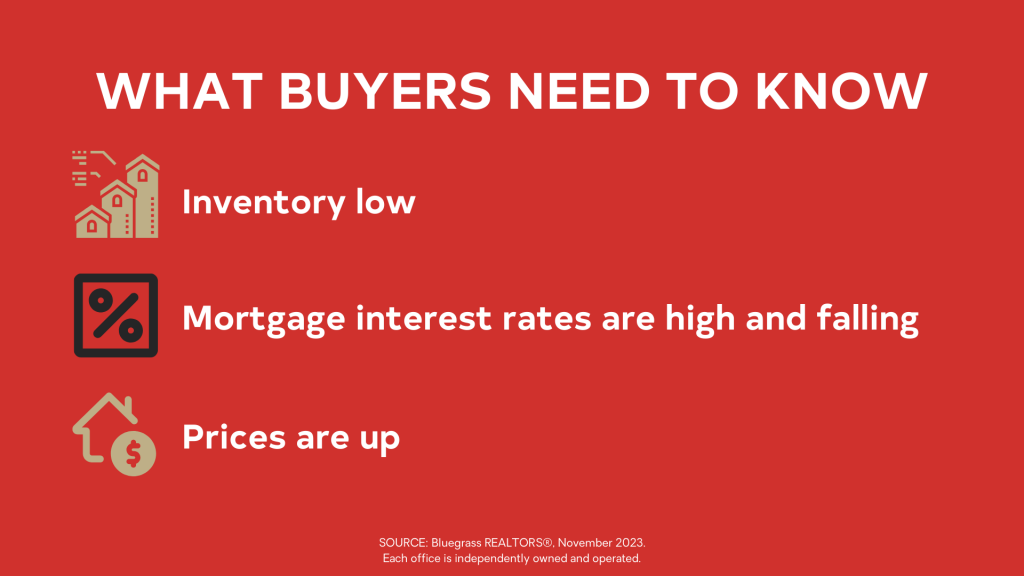
One of the biggest factors determining the number of homes listed and sold was mortgage interest rates. Home sellers don’t want to give up their current low rates and higher mortgage interest rates make homes less affordable for home buyers.
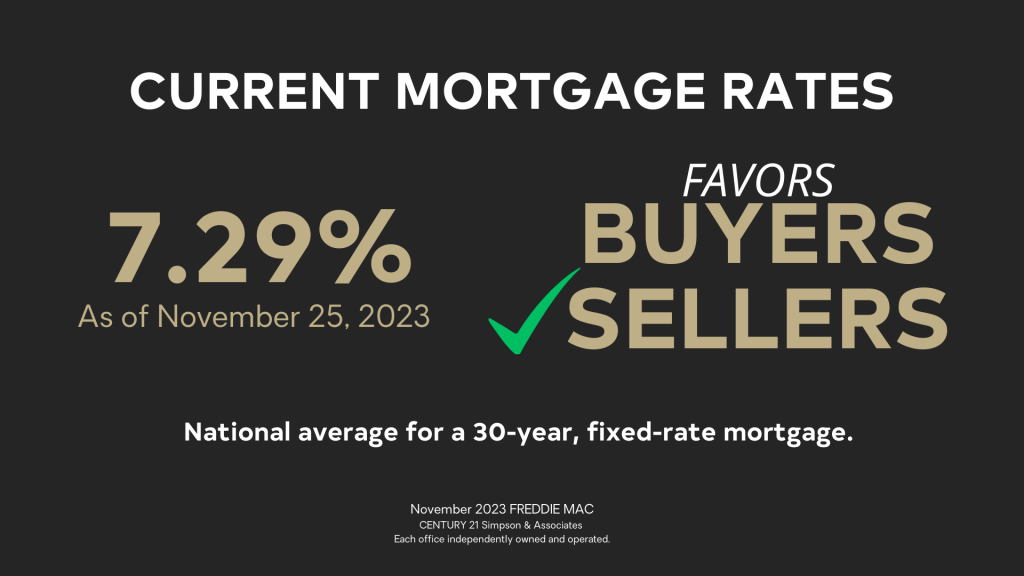
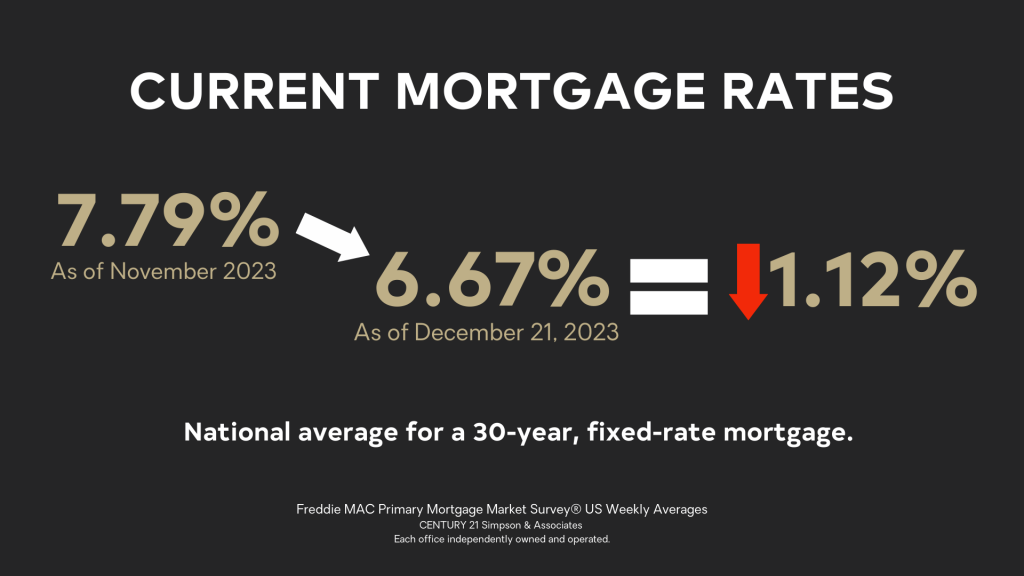
For sellers, mortgage interest rates are important because they determine the size of the pool of potential buyers and the speed of the selling process. Mortgage interest rates vary by area, lender, and type of financing. For reference, we look at the national rate for a 30-year fixed-rate mortgage.
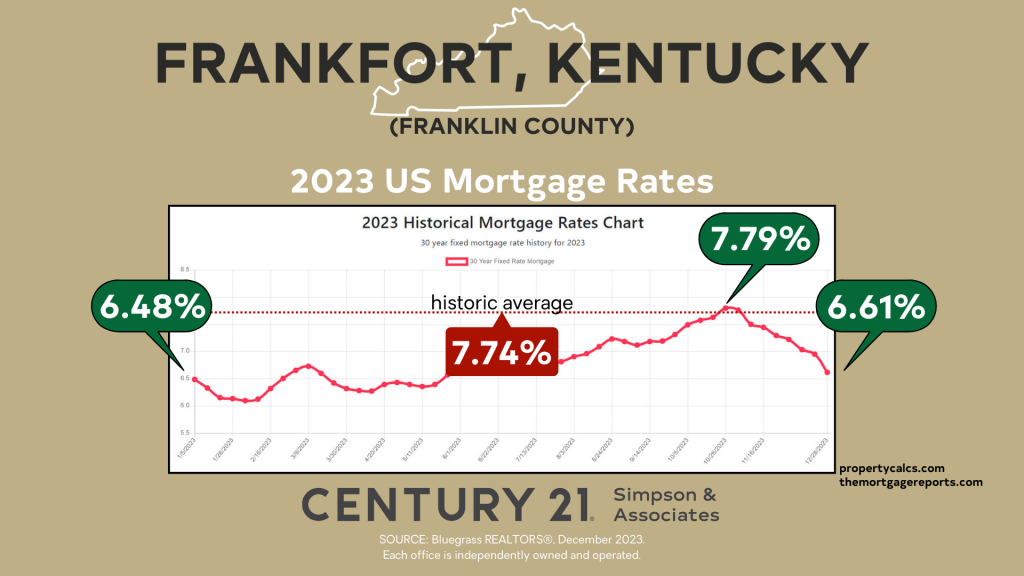
The mortgage rate was 6.48% at the beginning of 2023 and rose to a high of 7.79% in October before falling more than 1% to 6.61% by the end of the year – almost back to where it began. While mortgage interest rates are high compared to the last few years, they are below the historic average of 7.74% based on data collected since 1971.
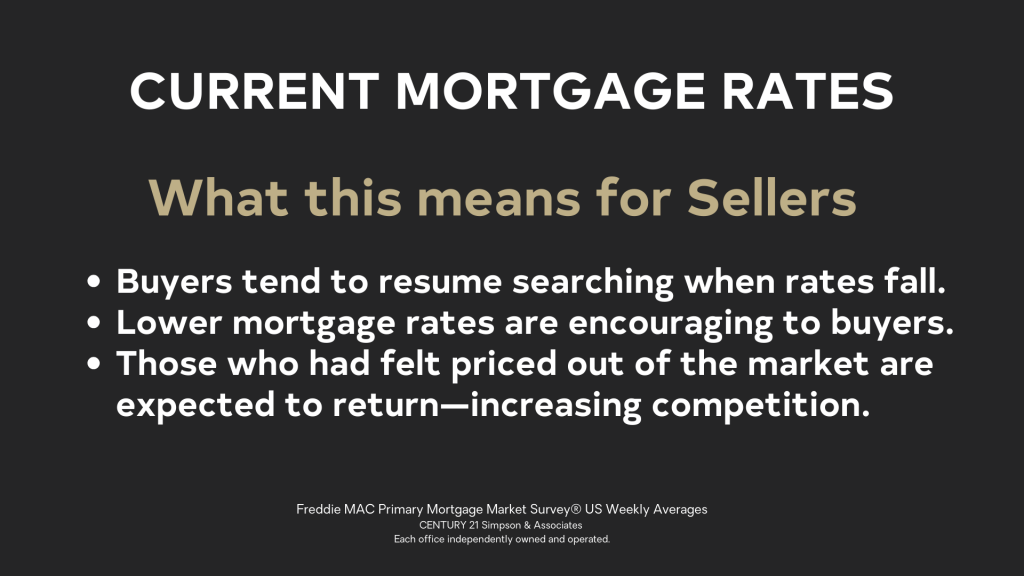
When rates fall, sellers benefit because buyers tend to resume their searches. Lower mortgage rates are encouraging to buyers. Those who had felt priced out of the market start to return—increasing competition.
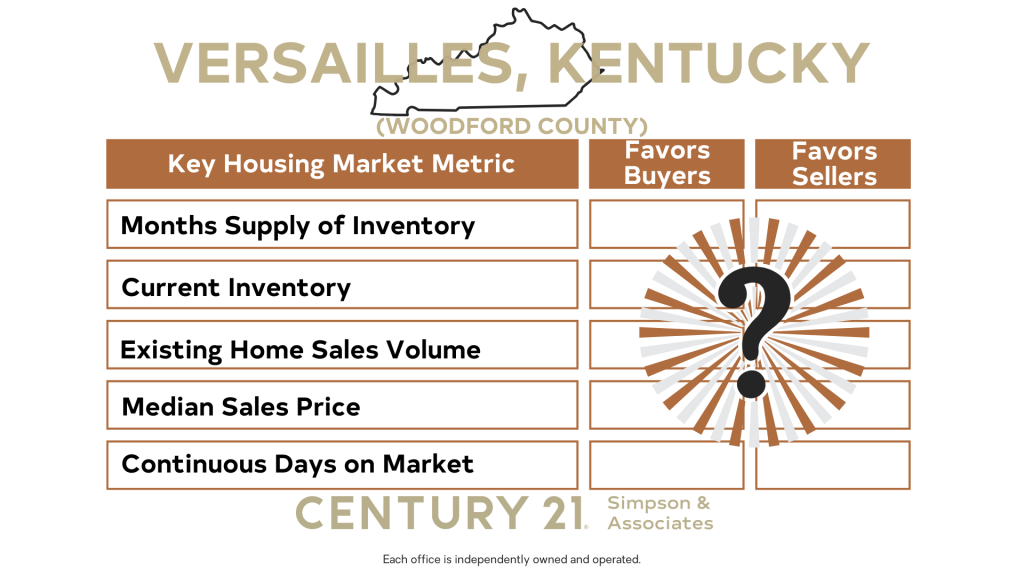
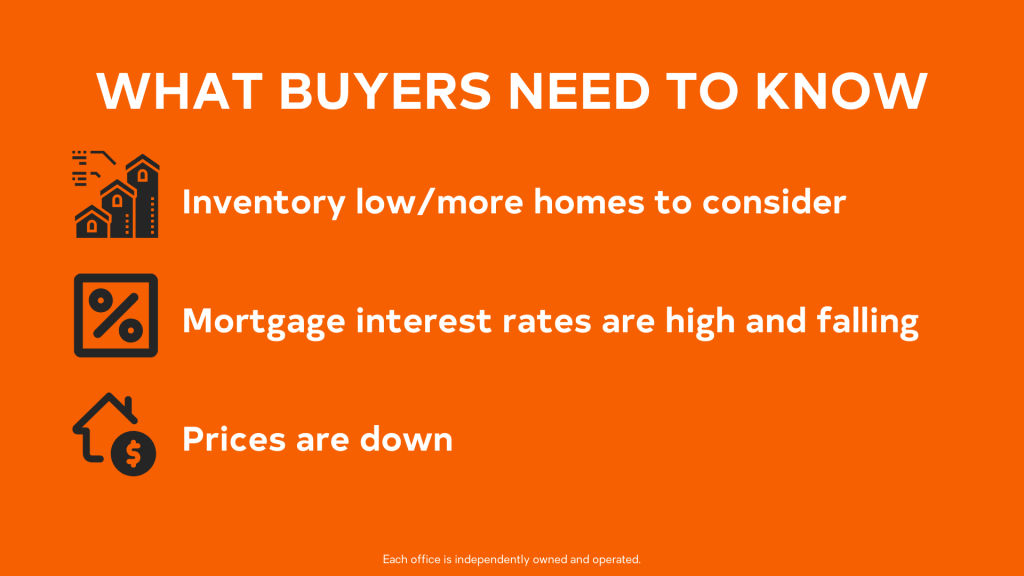
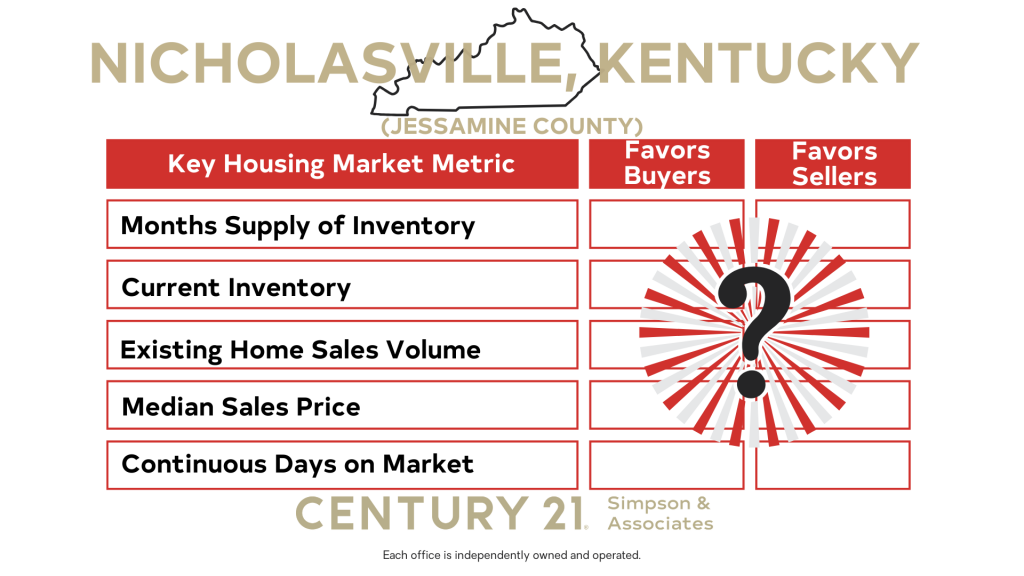
Now that we have an overview of the real estate market in 2023, let’s consider the most common questions sellers have about the current real estate market.

The latest local real estate market indicators from December 2023 can provide the answers.
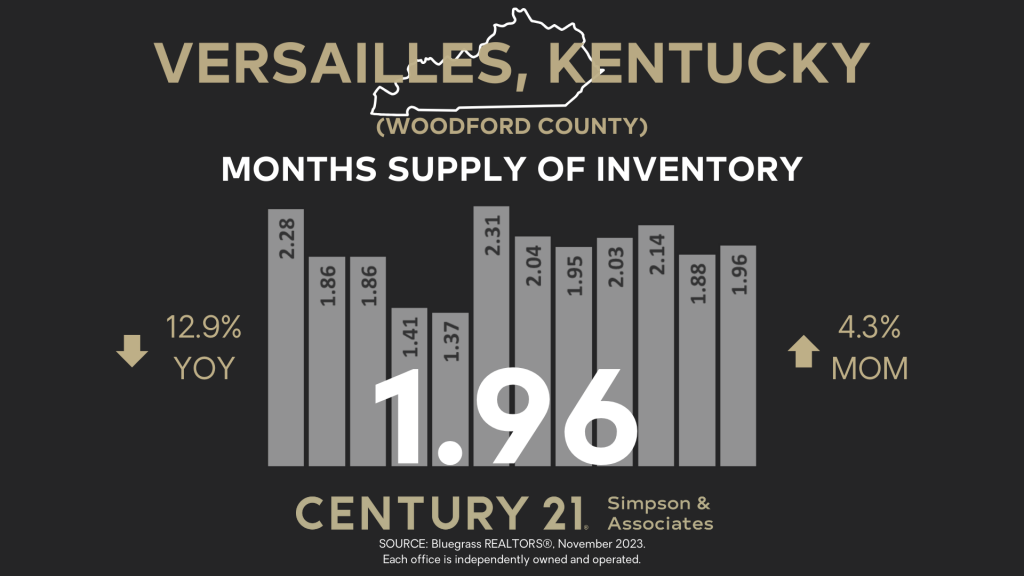
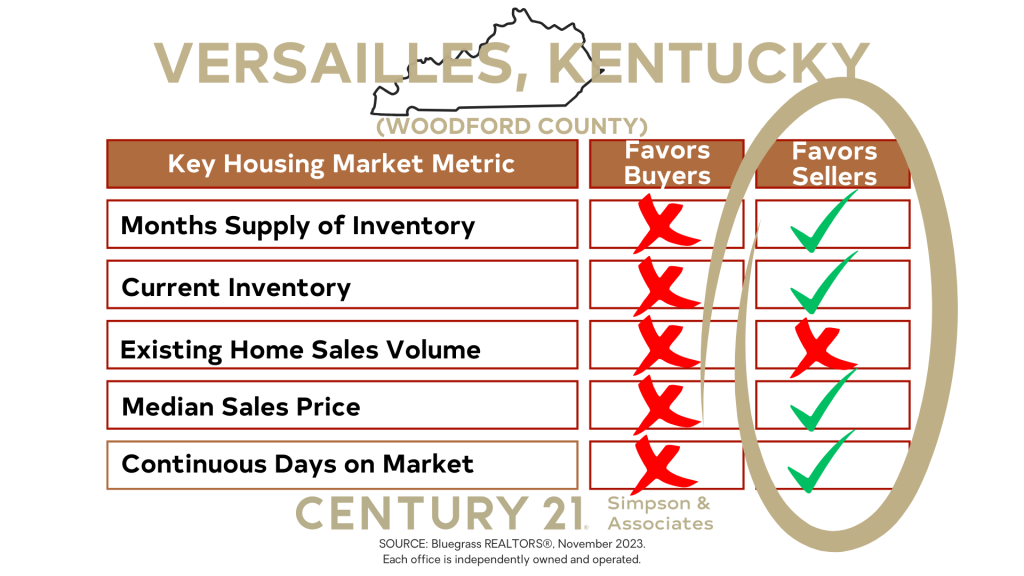
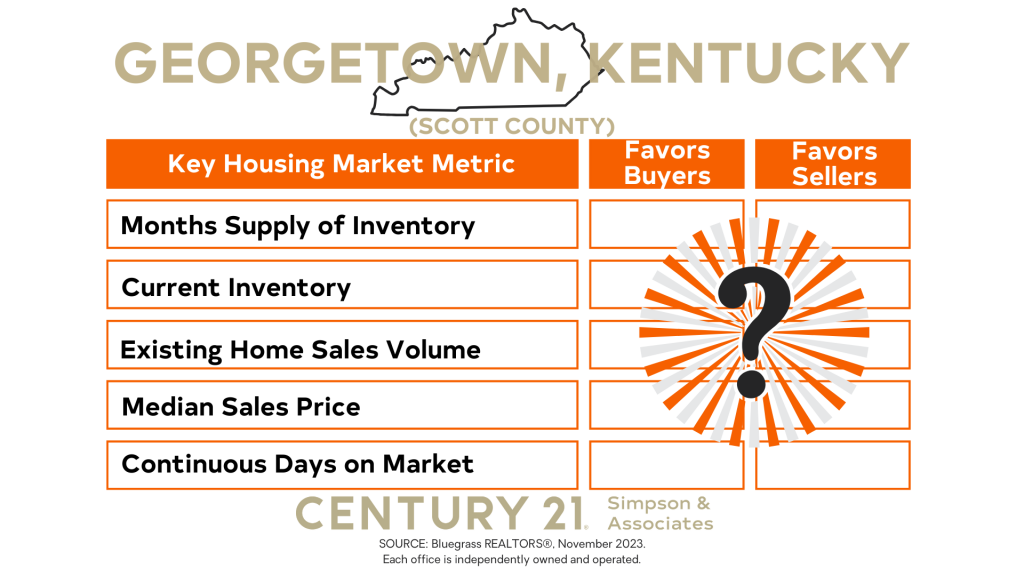
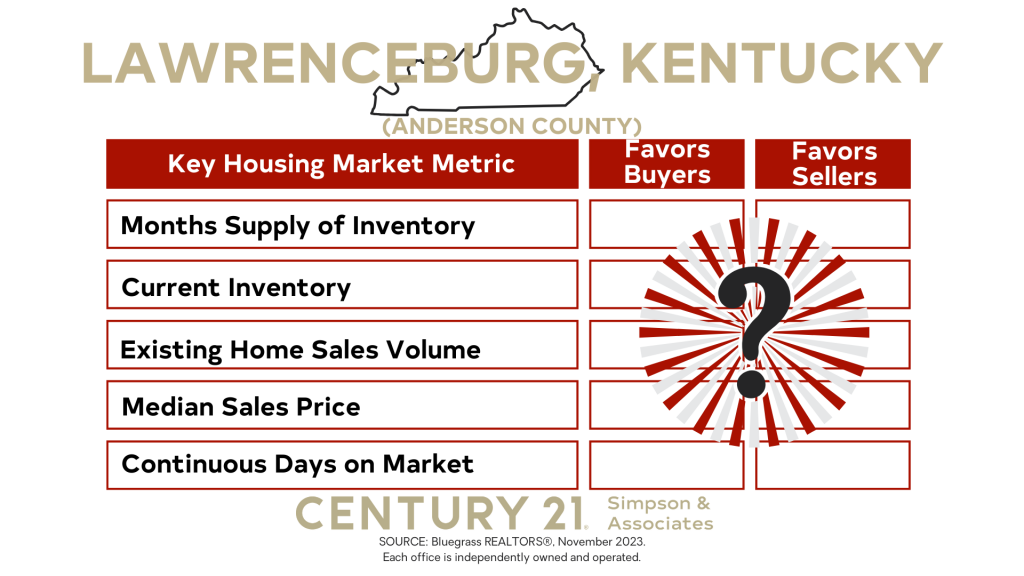
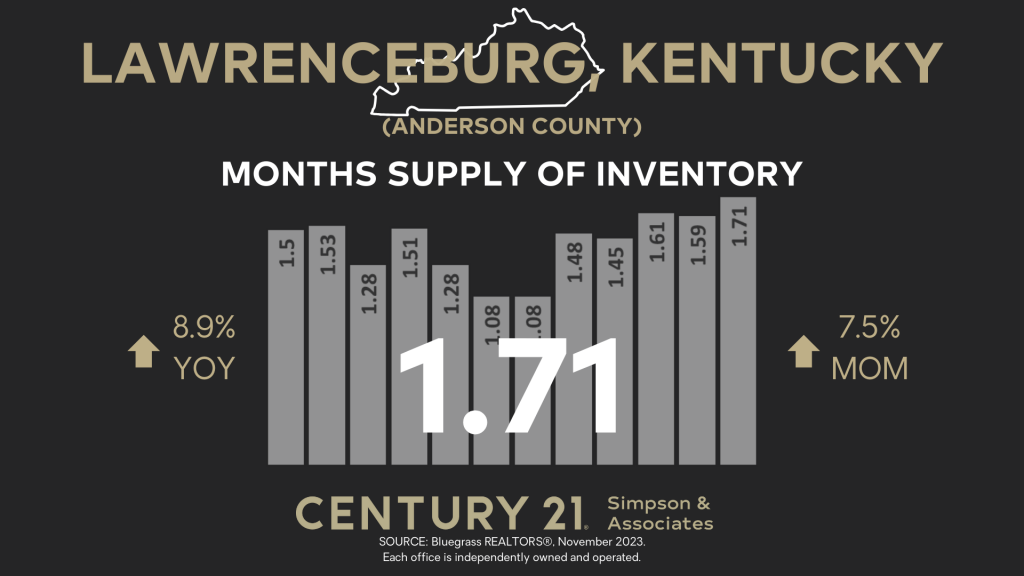
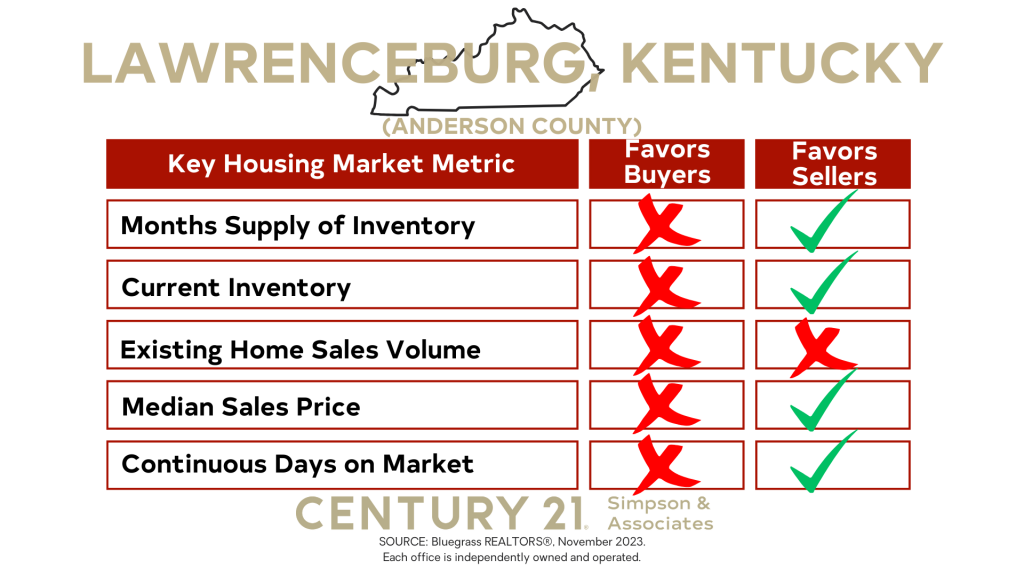
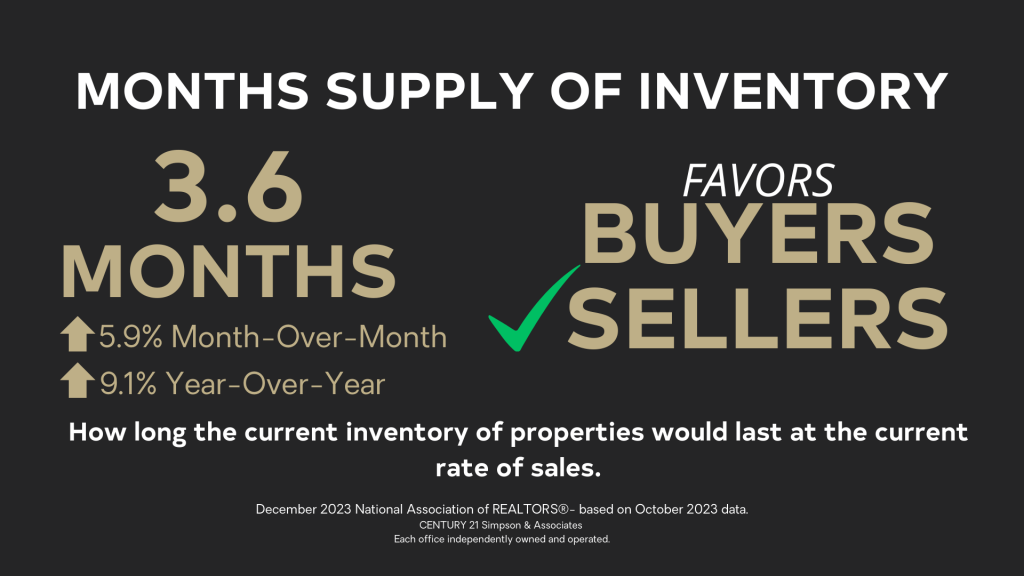
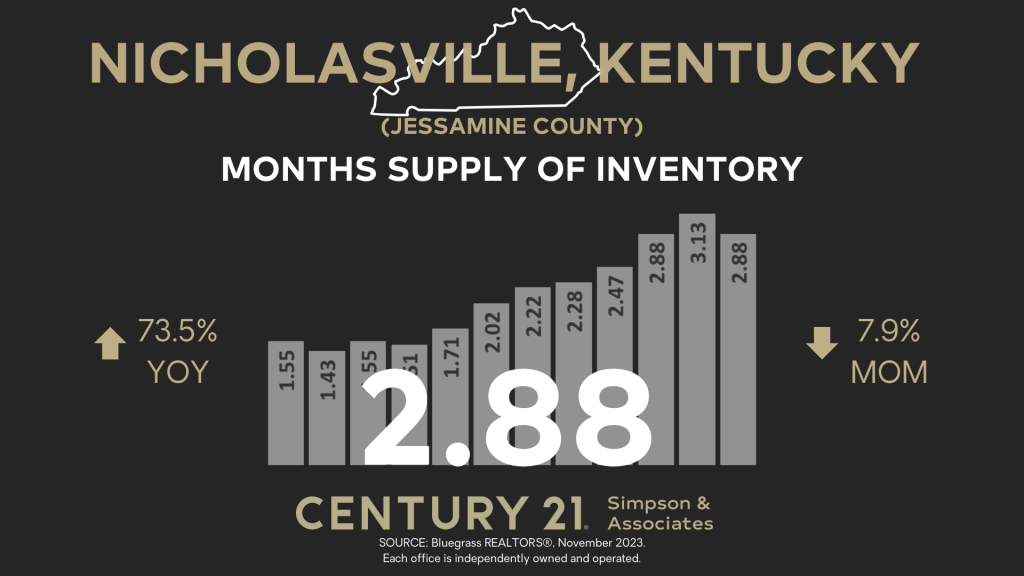
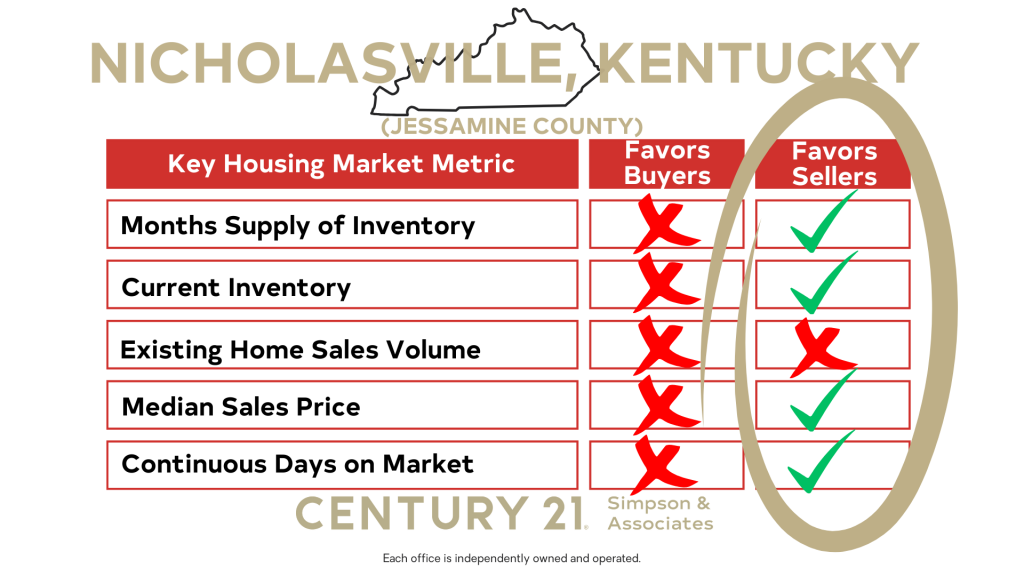
Let’s start with Months Supply of Inventory which answers the question, “Is it a sellers’ market?” It also provides insights into another question, “How quickly is the market moving?”
This indicator tells us about the balance between supply and demand in the real estate market and whether the current market favors buyers or sellers.
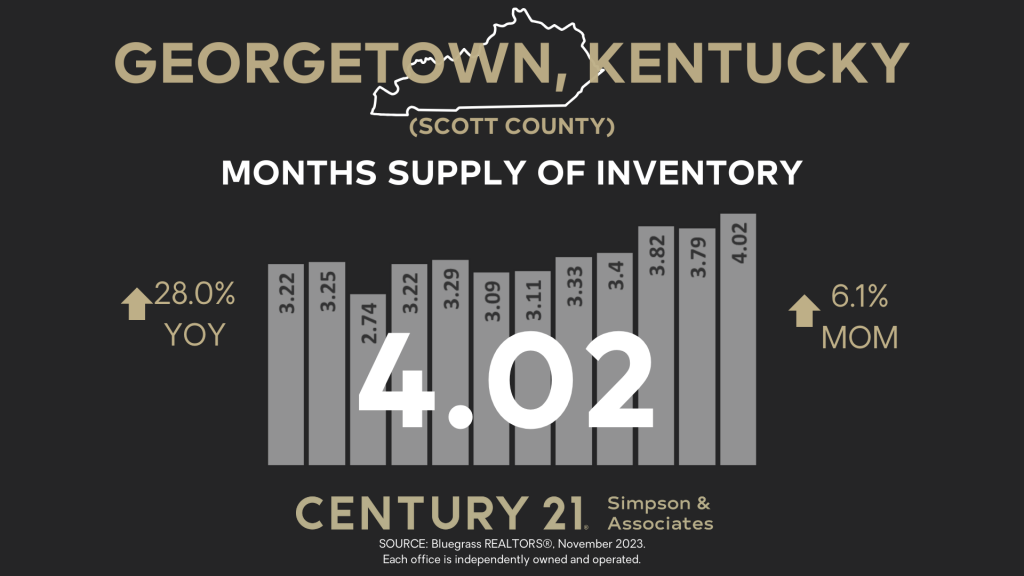
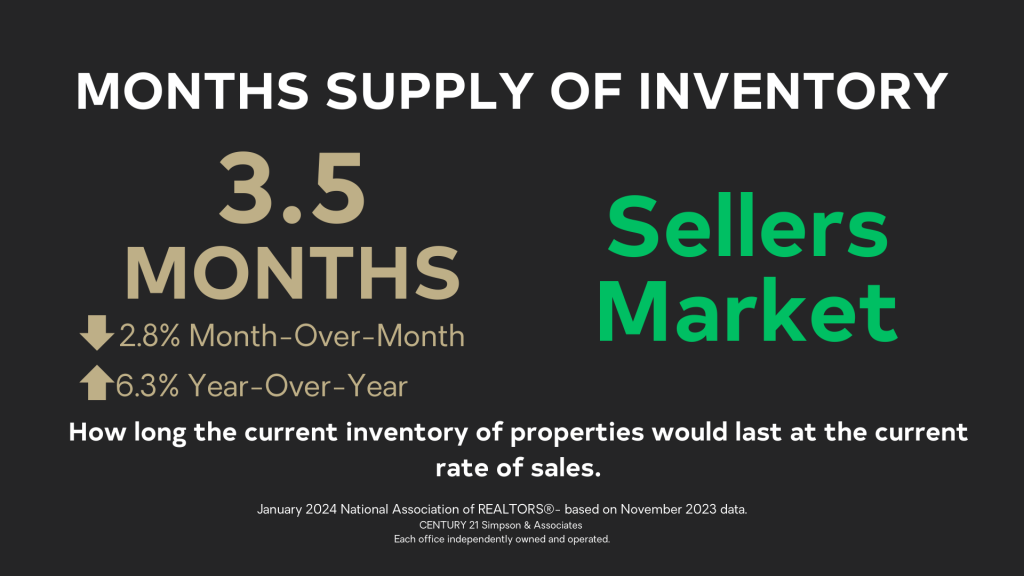
Months Supply of Inventory measures how long the current inventory of properties available for purchase would last at the current rate of sales if no new properties came on the market.
Six months of inventory represents a balanced market, favoring neither buyer nor seller. When Months Supply of Inventory is below 6 months, it is considered a sellers’ market.
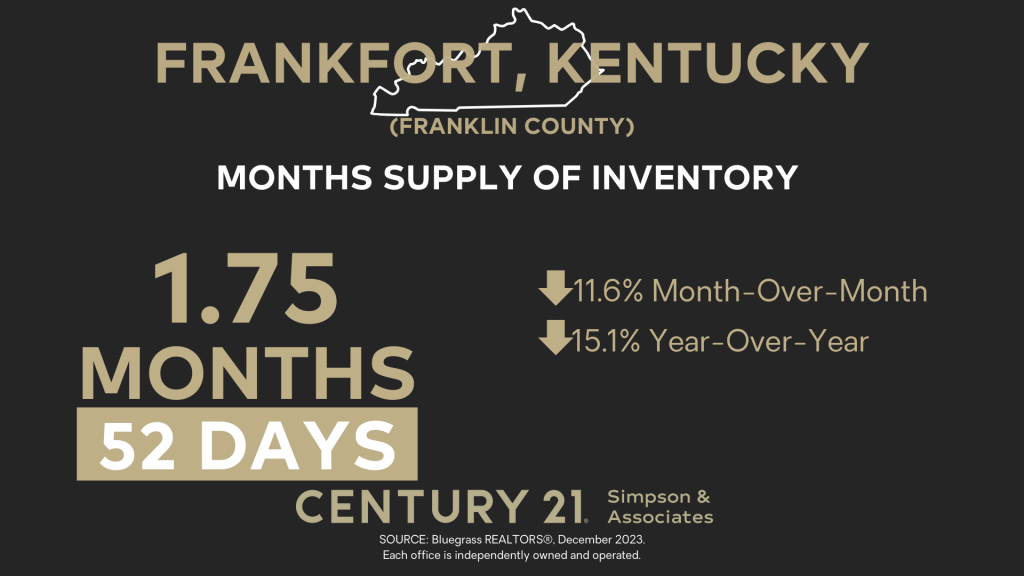
In Frankfort-Franklin County, the months supply of inventory fell to 1.75 months or around 52 days. That’s an 11.6% decrease over the previous month and 15.1% lower than a year ago.
For context, over the past decade, the average months supply of inventory was 3.9 months.
At 1.75 months supply of inventory, the market continues to favor sellers. There are simply not enough homes on the market to meet buyer demand.
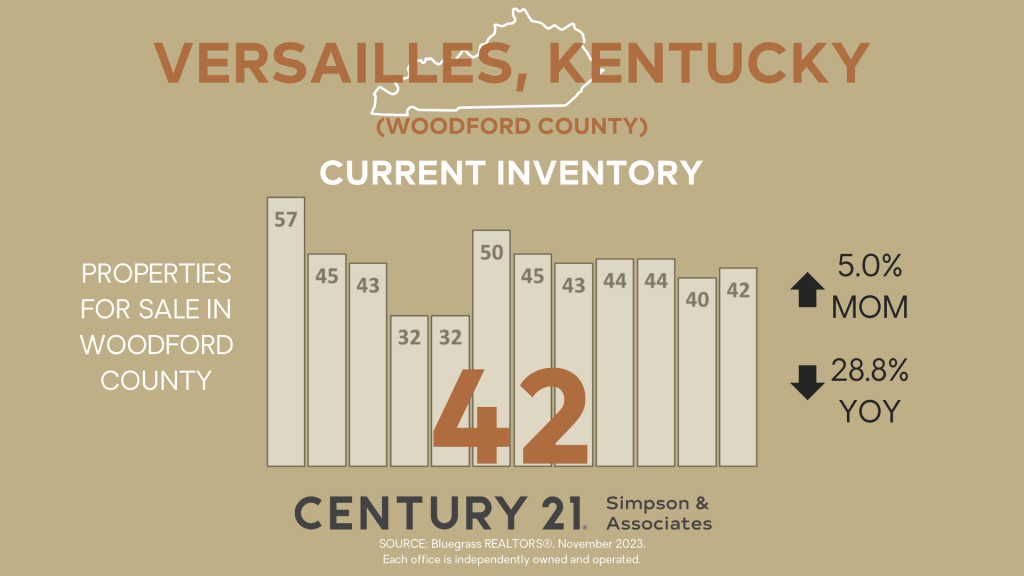
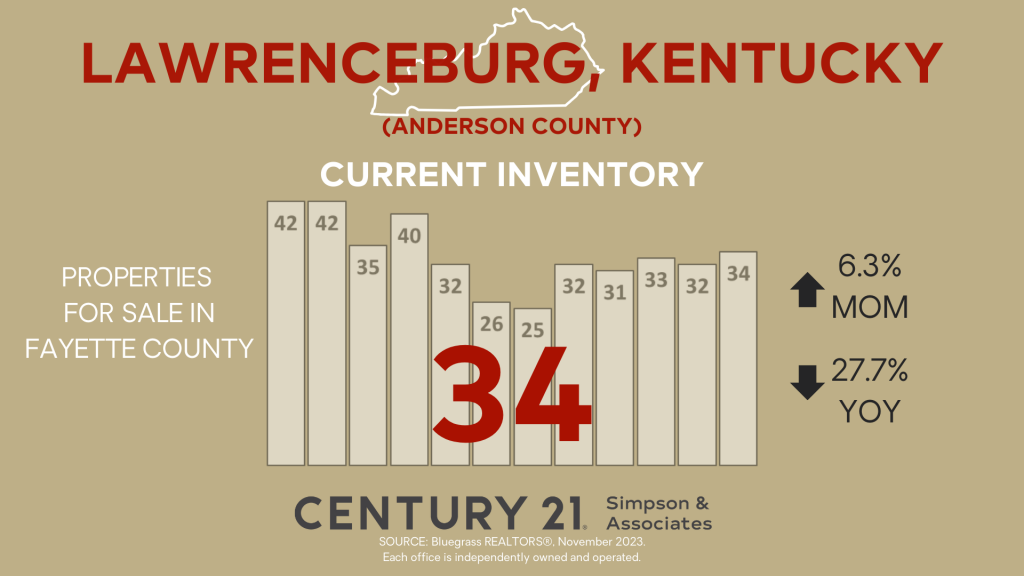
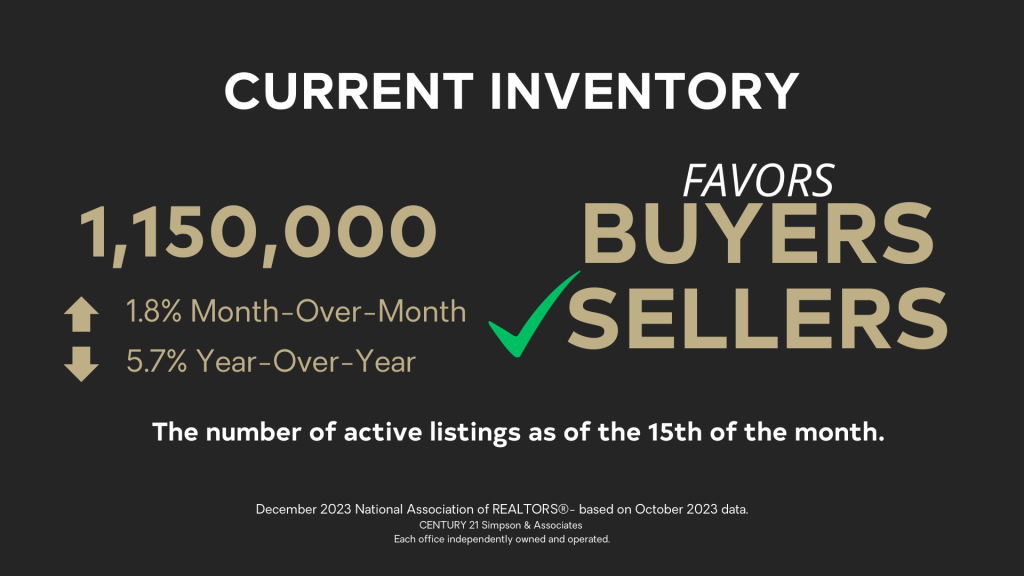
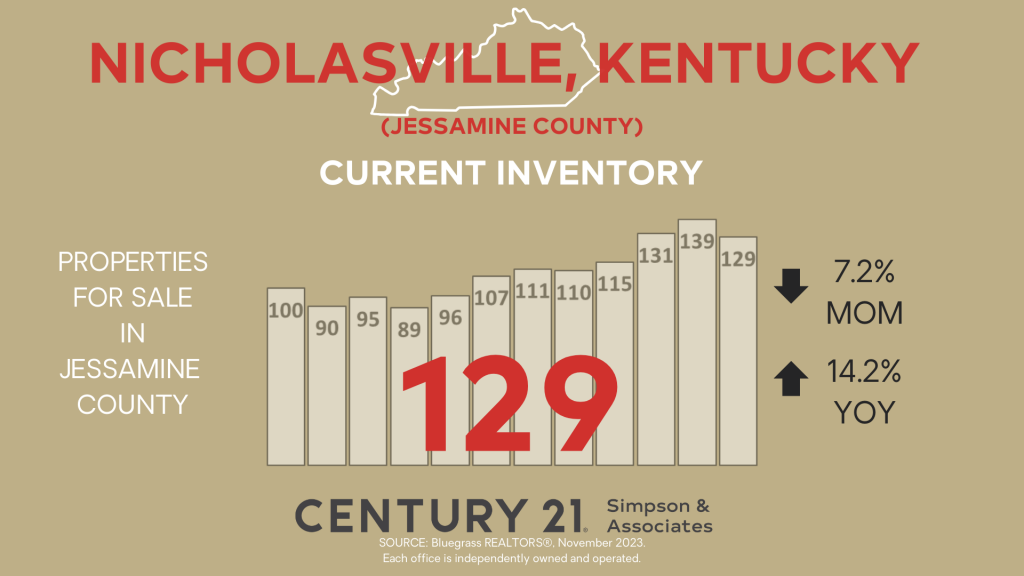
Now, let’s shift our focus to the Current Inventory. It is another measure that provides insights into the question, “How quickly is the market moving?”
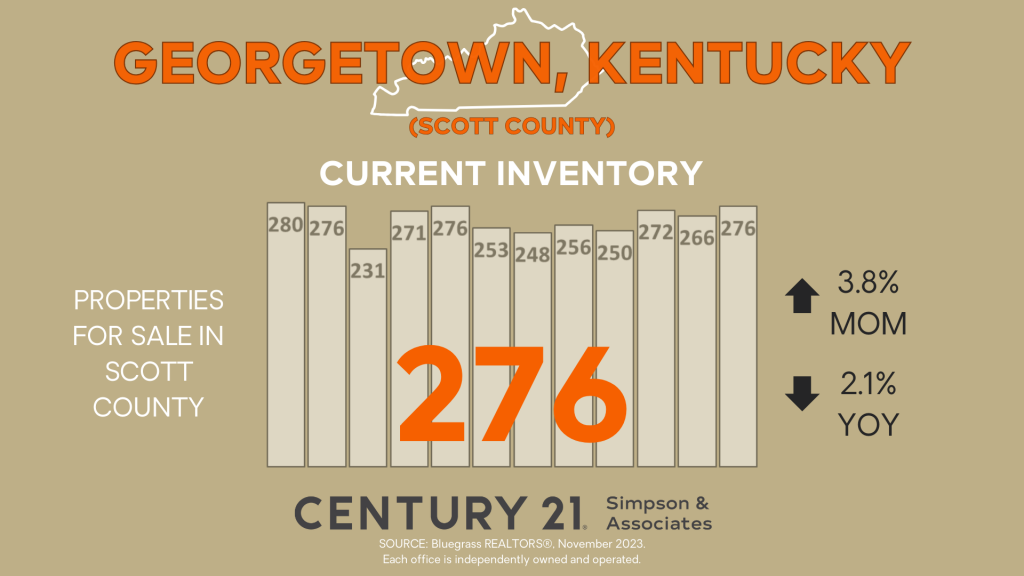
Current Inventory is a catalyst in determining the market dynamics and serves as a balancing act for both home sellers and homebuyers. When current inventory is low, the market dynamics favor home sellers by fueling demand, fostering increased competition, accelerating sales, and driving the potential for elevated property prices.
This indicator gives us a snapshot of the number of homes currently available for sale. It’s important to note that the number of homes on the market can vary as it depends on when the report is generated. By consistently using the same day each month, we can establish meaningful month-to-month trends.
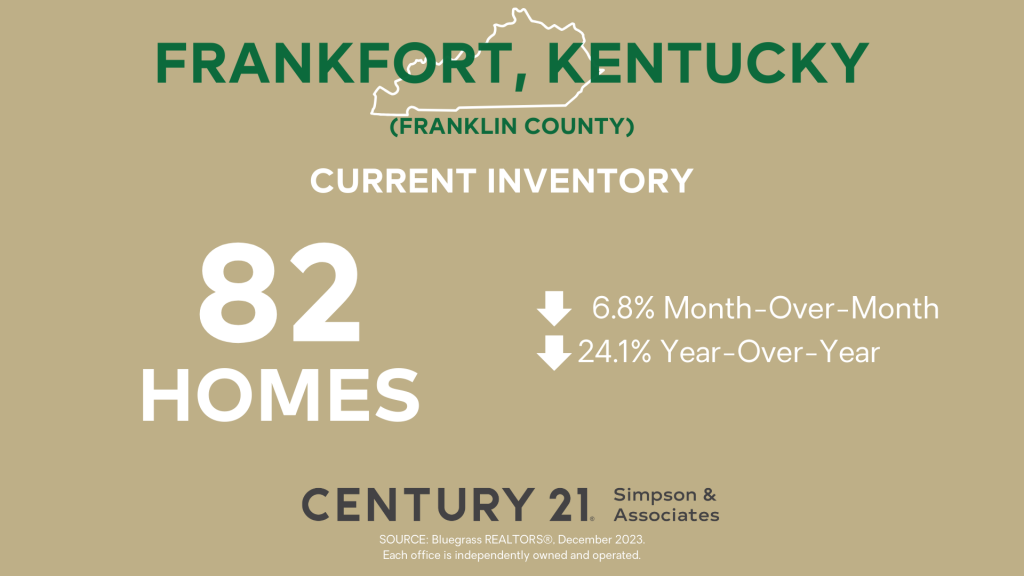
As of December 15th, there were 82 homes available on the market in Frankfort-Franklin County. This represents a 6.8% decrease compared to the previous month. Compared to last year, when there were 108 homes on the market, we observe a 24.1% decrease in the number of available homes.
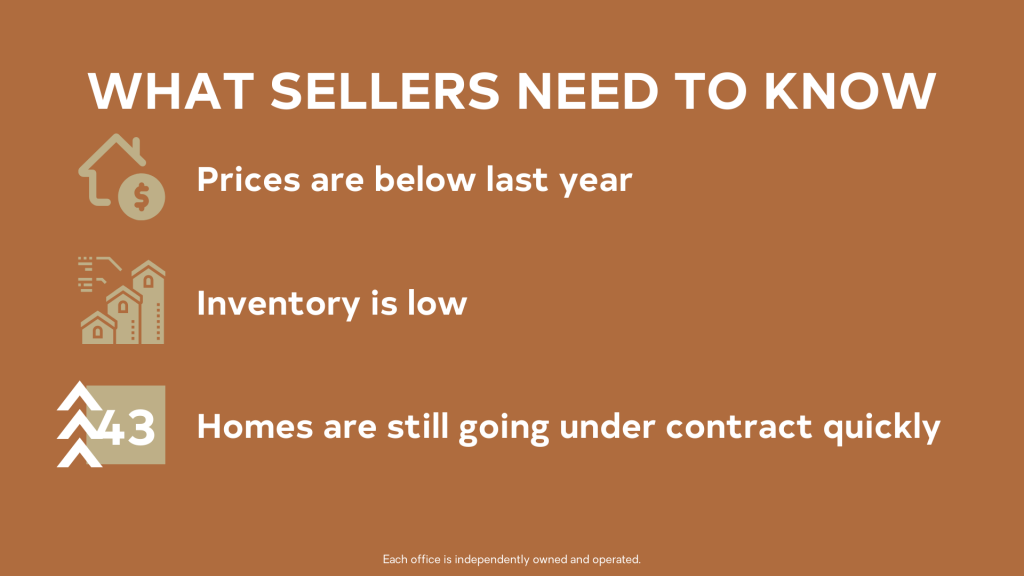
For sellers, low inventory signals scarcity, driving heightened demand, increased buyer competition, faster sales, and potential for higher property prices.
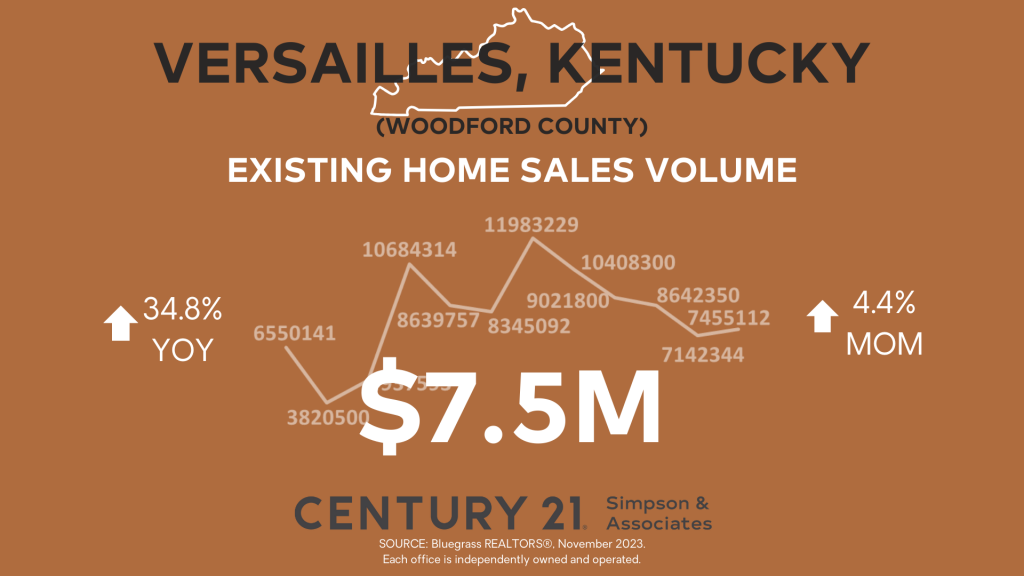
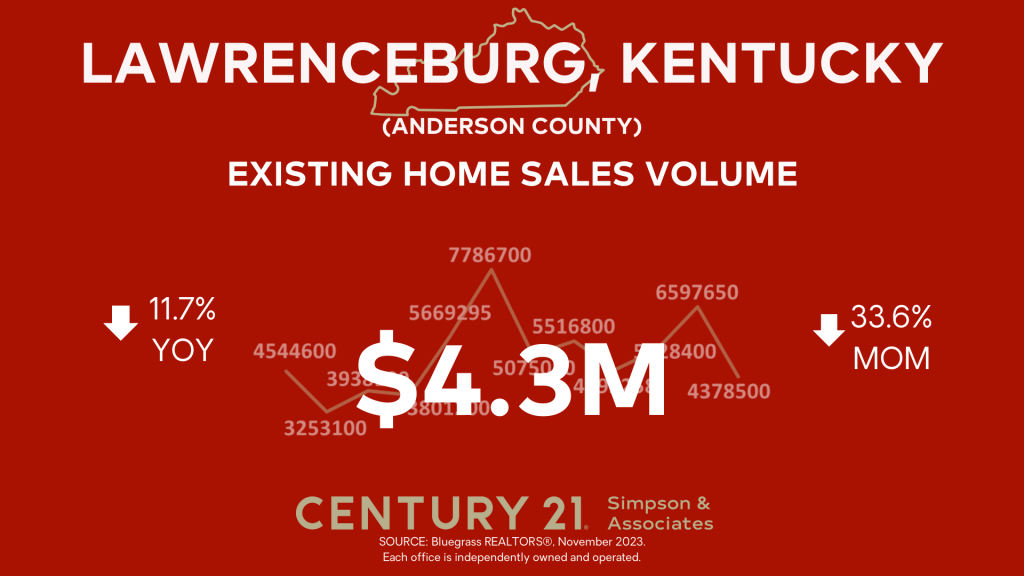
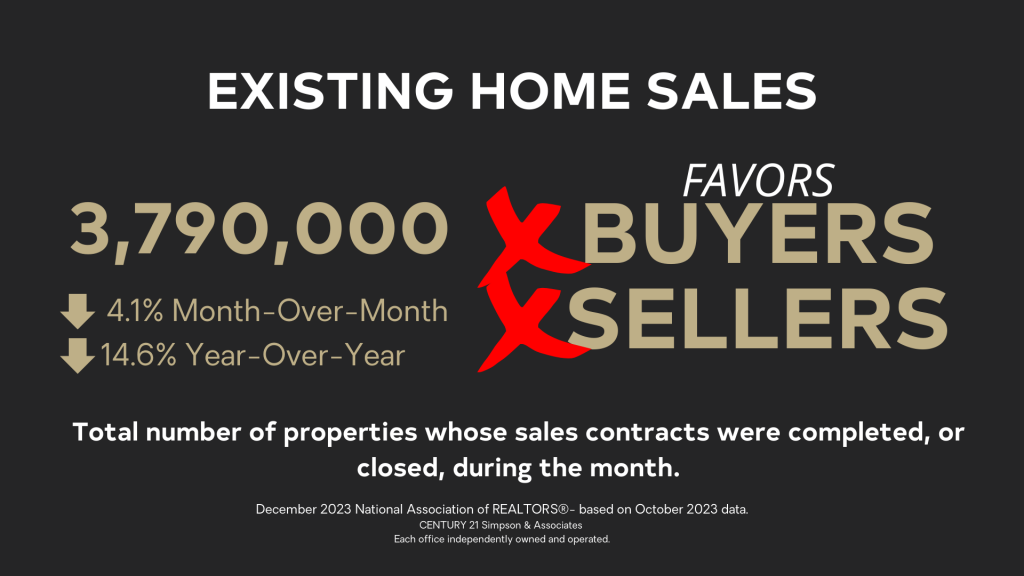
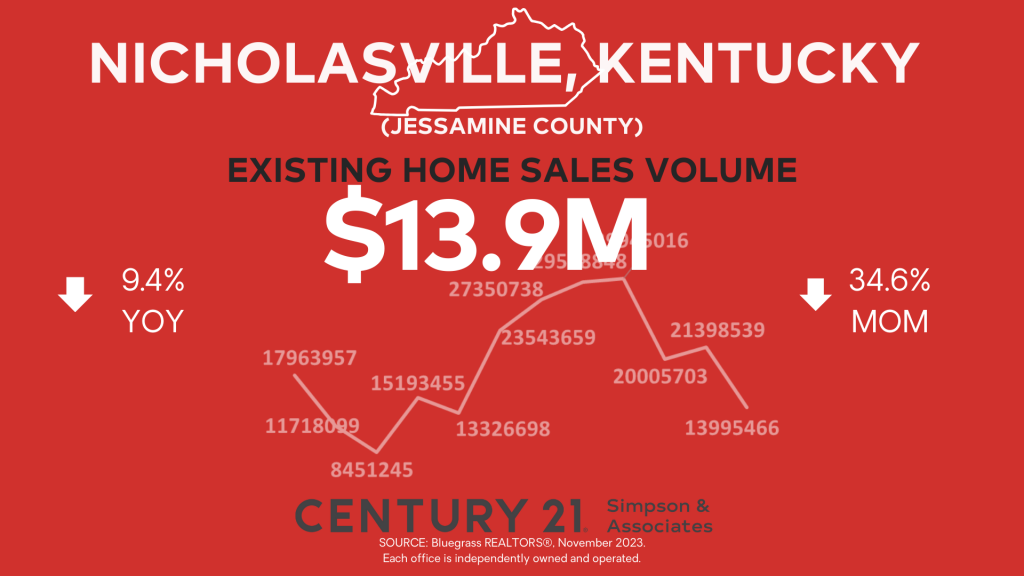
Our third indicator is Existing Home Sales Volume. It is a third measure that provides insights into, “How quickly is the market moving?”
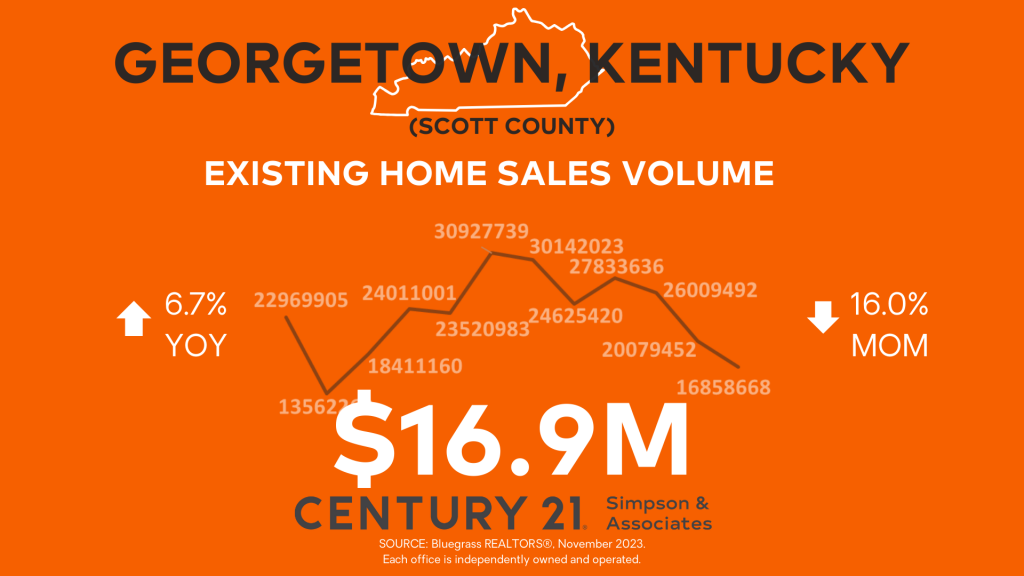
This indicator tells us about the pace of the market. A faster pace favors sellers.
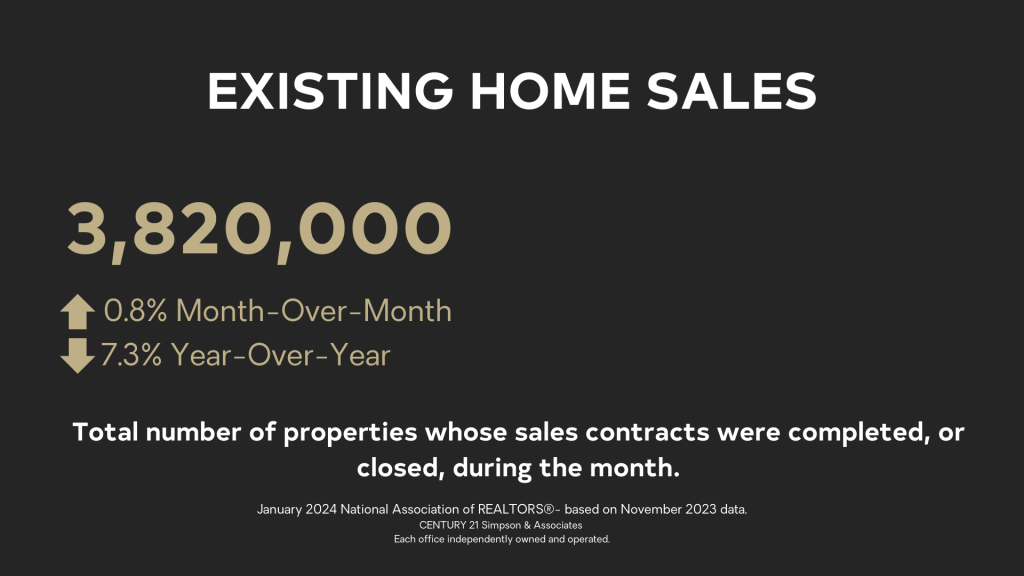
Existing home sales is the total number of all the properties whose sales contracts were completed, or closed, during the month.
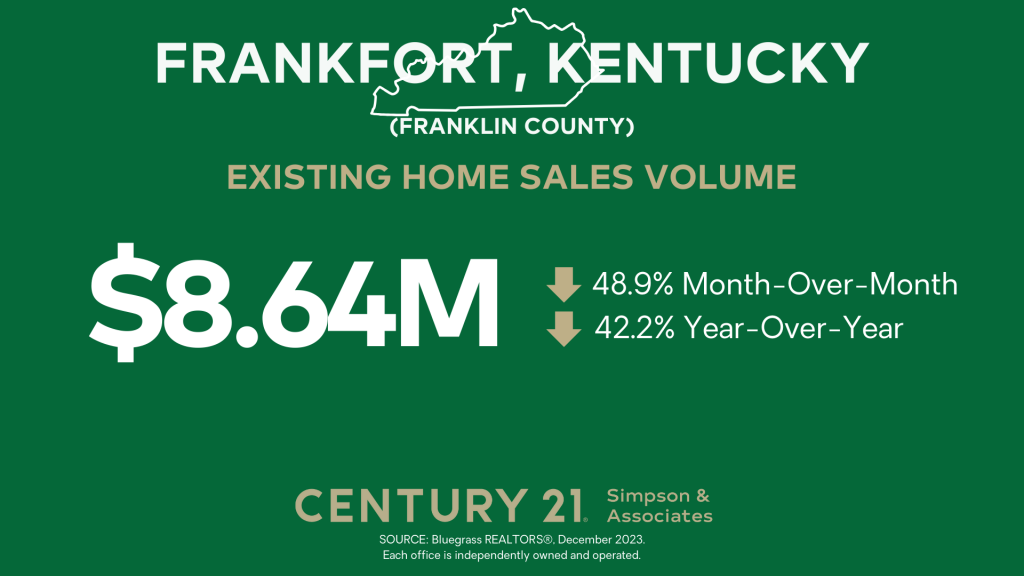
In December, 8.64 million dollars’ worth of property was sold in Frankfort-Franklin County. That’s 48.9% lower than in November and 42.2% lower compared to the previous year.
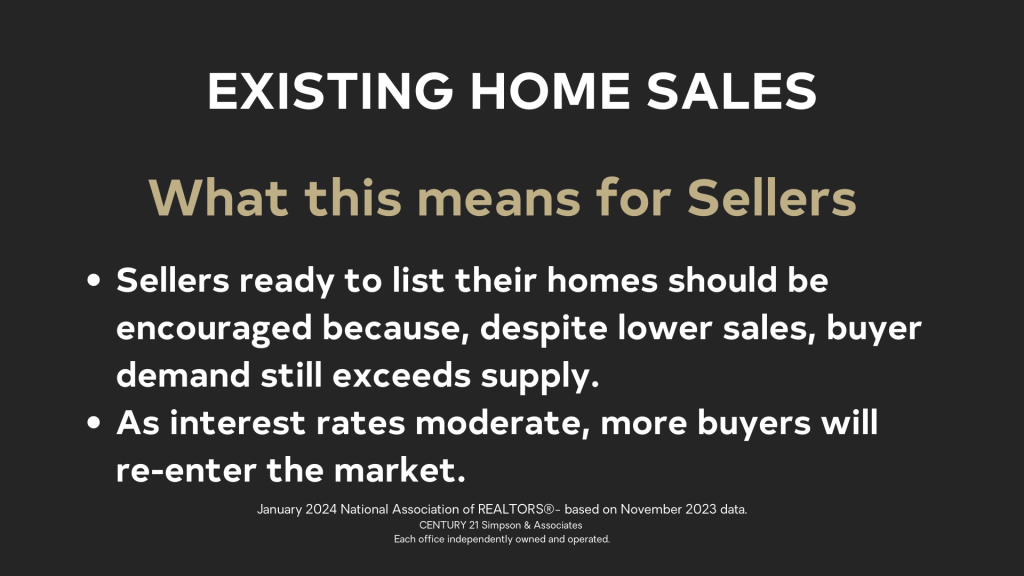
Sellers who are ready to list their homes should be encouraged that despite lower sales, buyer demand still exceeds supply. As mortgage rates moderate, more buyers will re-enter the market.
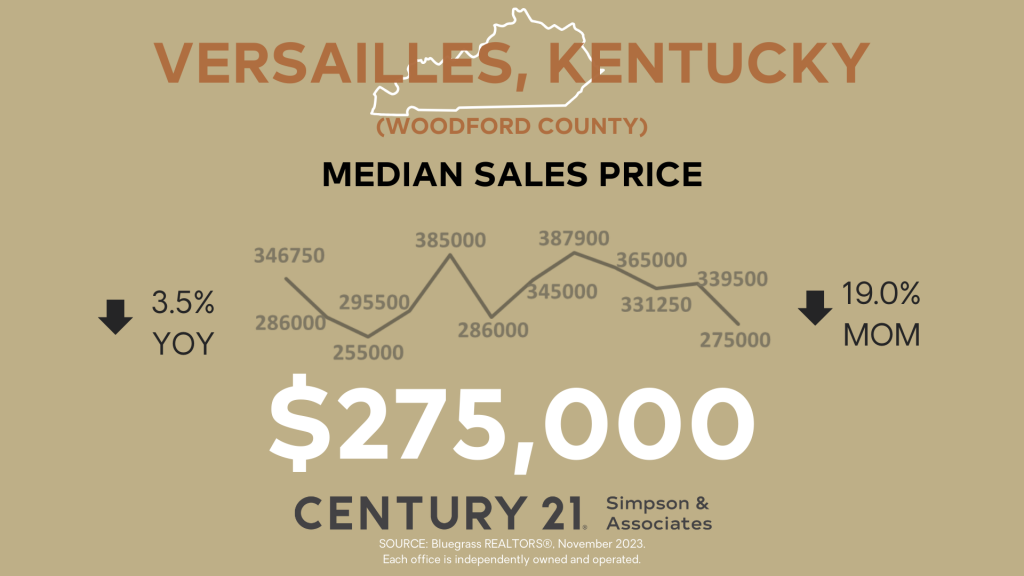
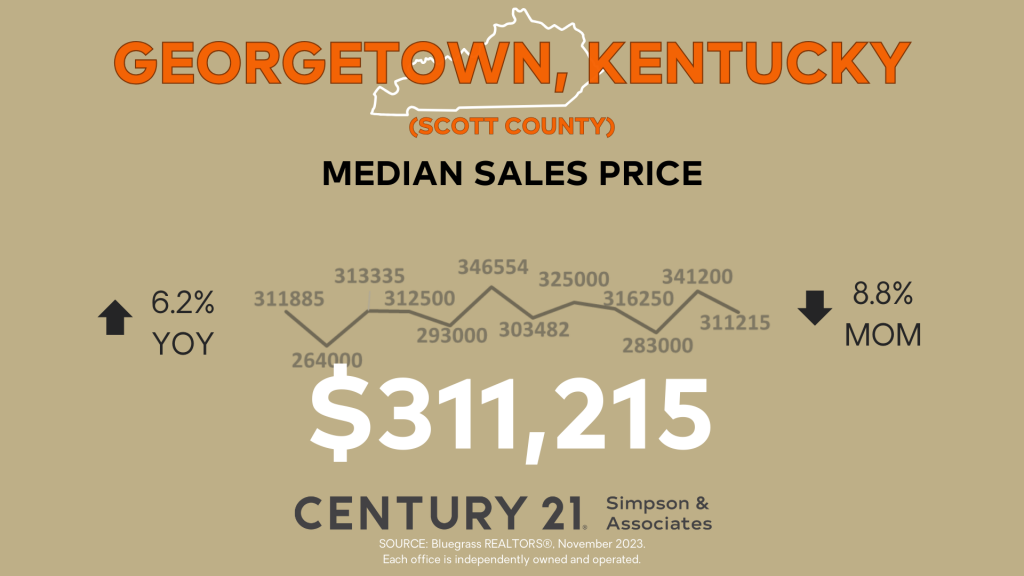
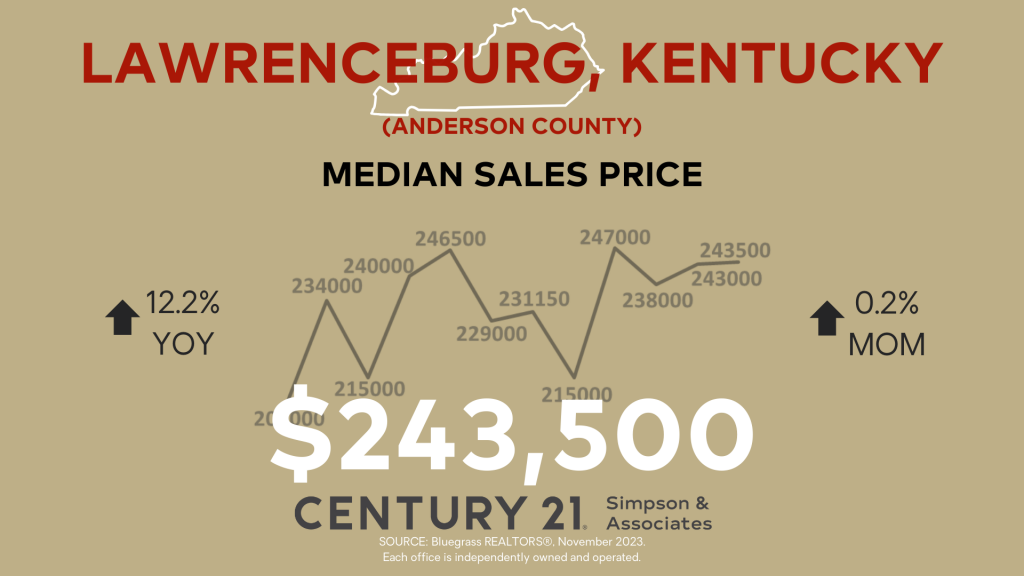
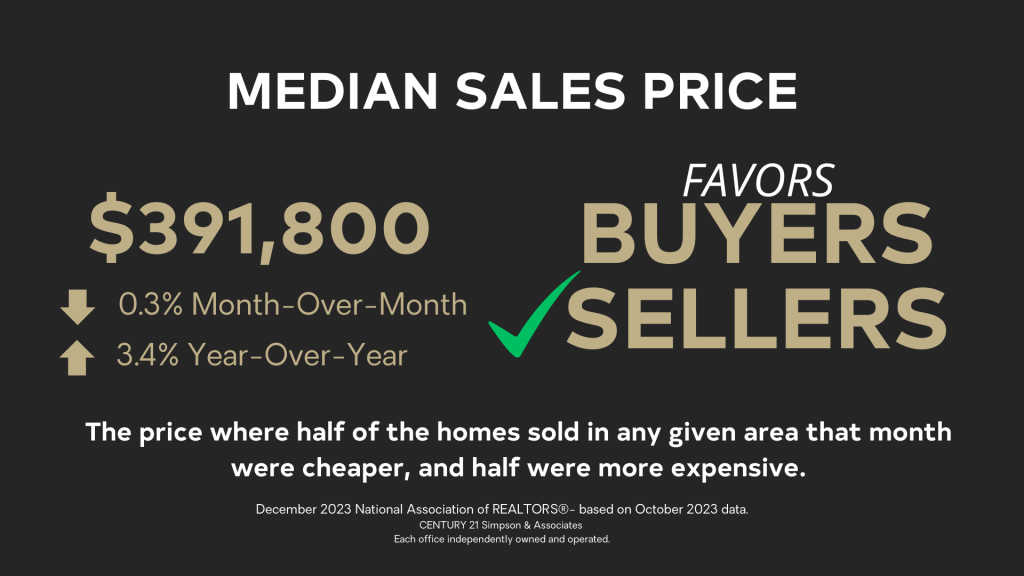
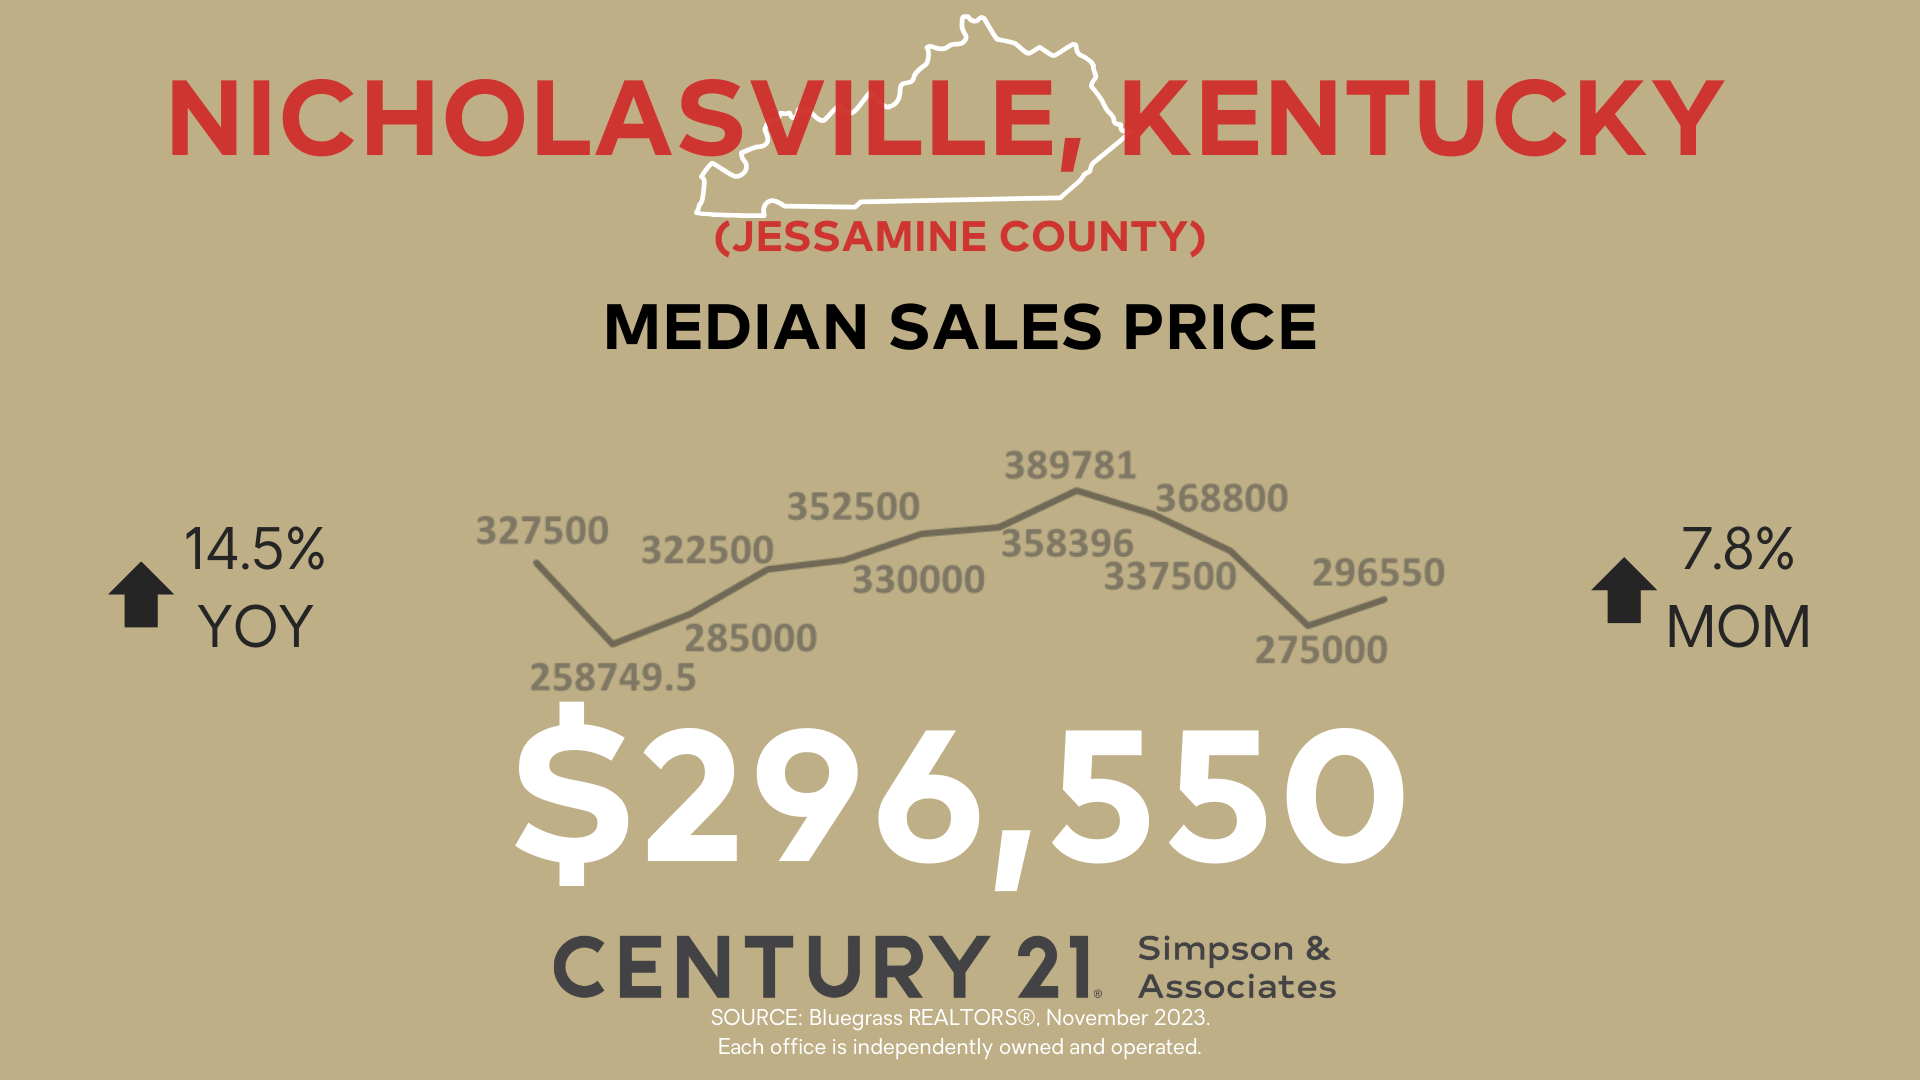
Next is the most-requested indicator, Median Sales Price. This indicator answers the question, “What are the pricing trends?”
This indicator helps us understand the core pricing trends of the market.
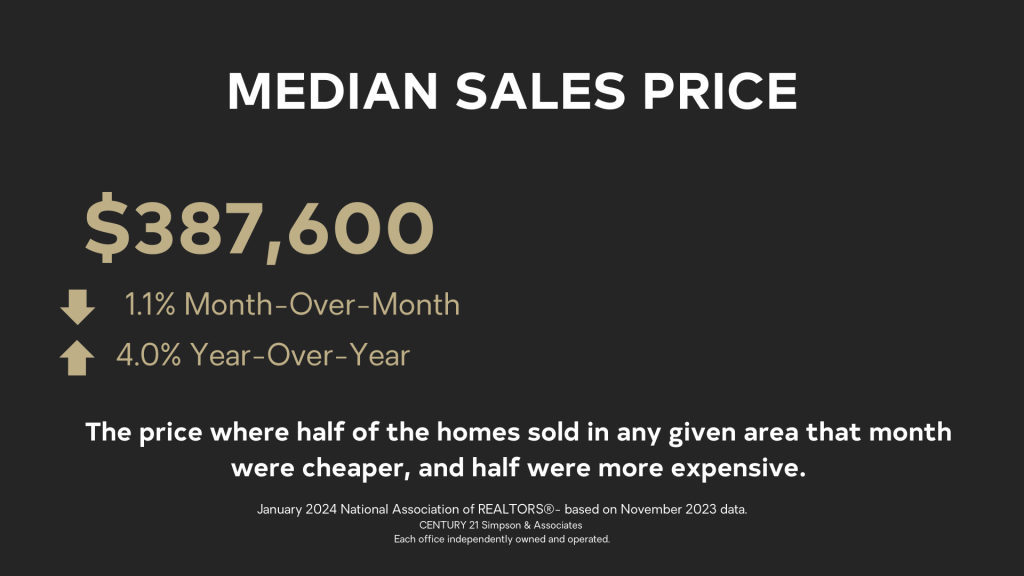
The median is the price where half of the homes sold in any given area that month were cheaper, and half were more expensive.
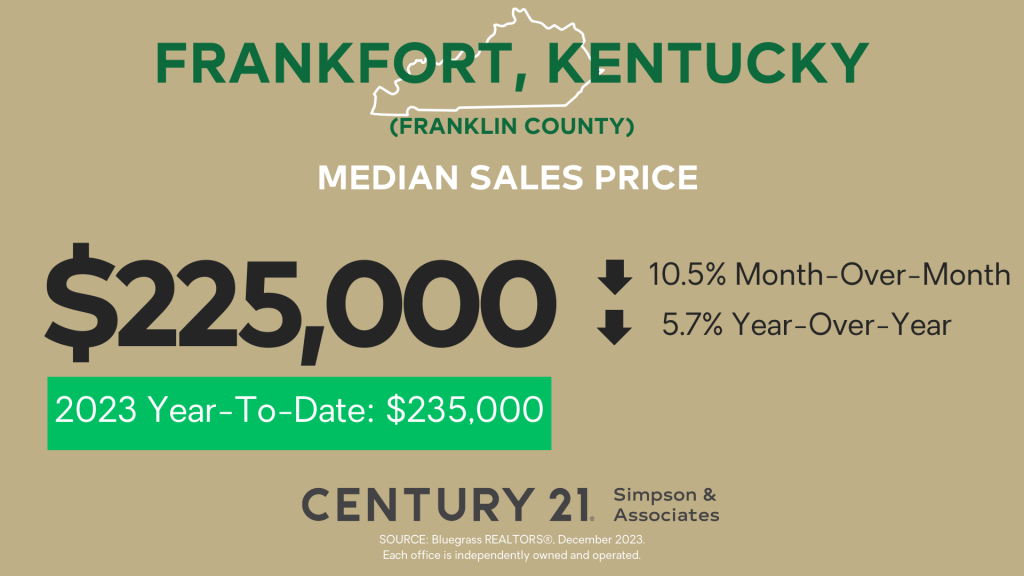
The median sales price of a home in Frankfort-Franklin County was $225,000, which was 10.5% less than the previous month and 5.7% lower than last year. Prices tend to dip at the end of the year. For the year, the median sales price was almost $235,000 which was above the median sales prices in 2021 and 2022.
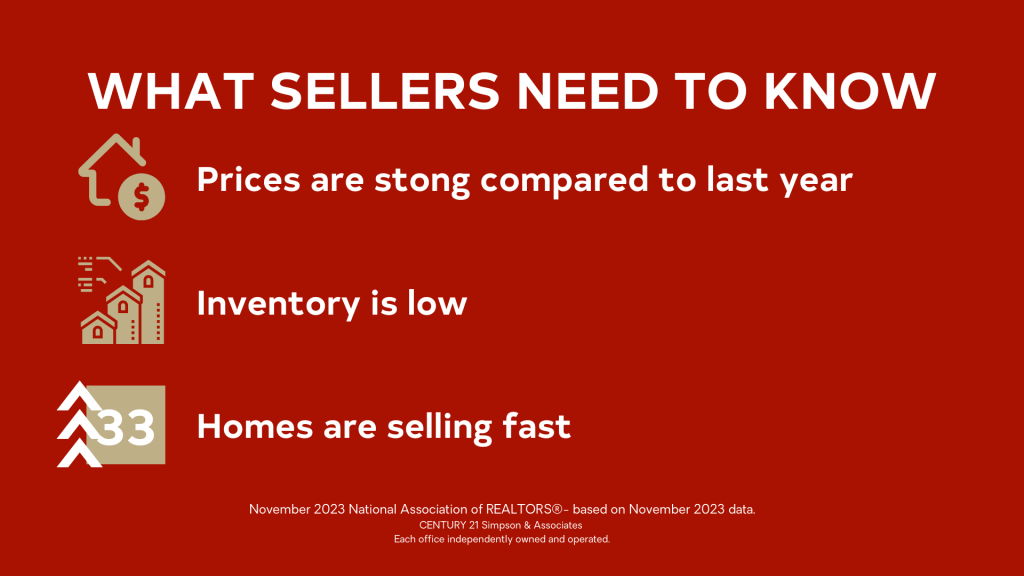
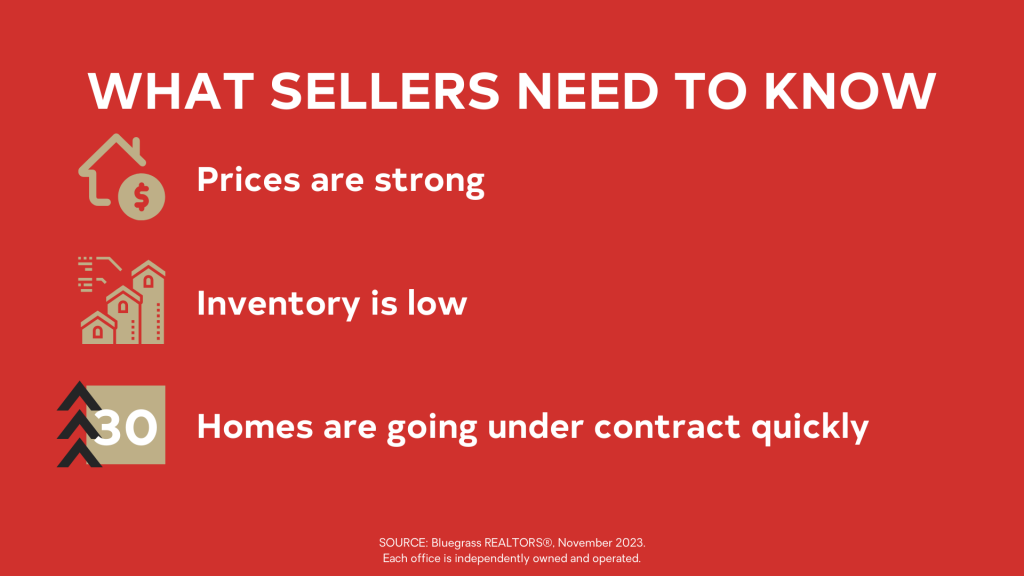
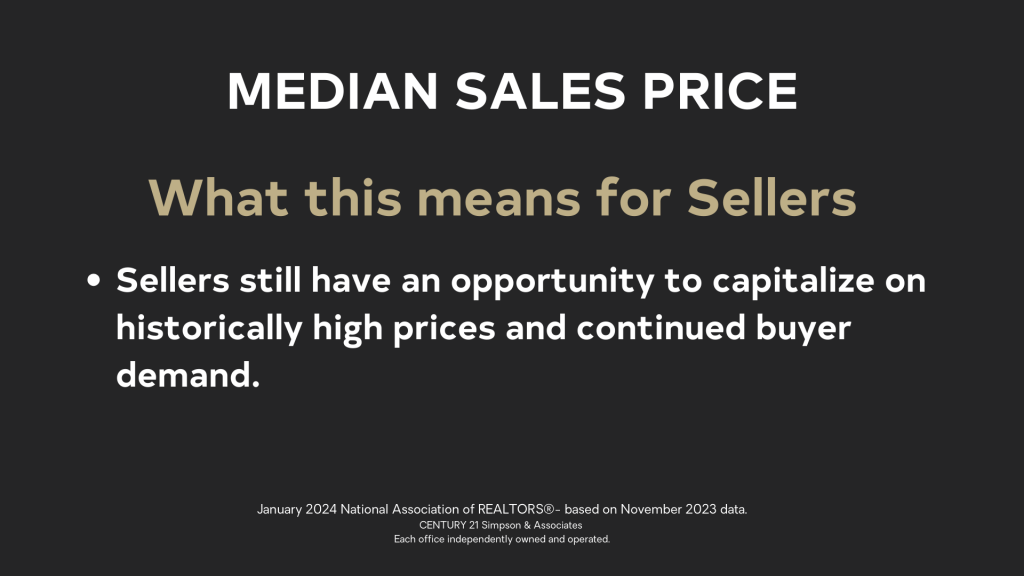
Sellers can still capitalize on historically high prices and continued buyer demand.
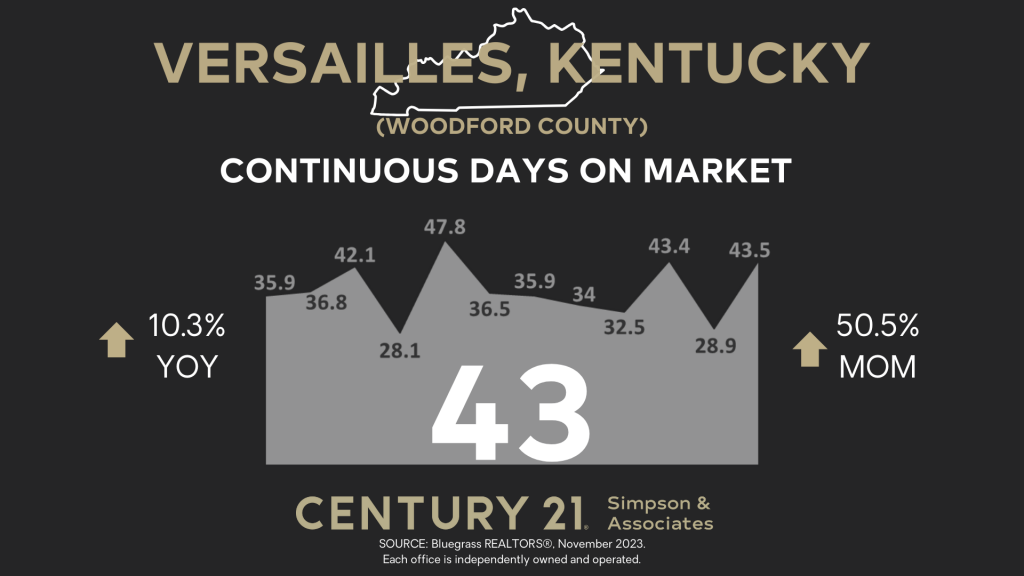
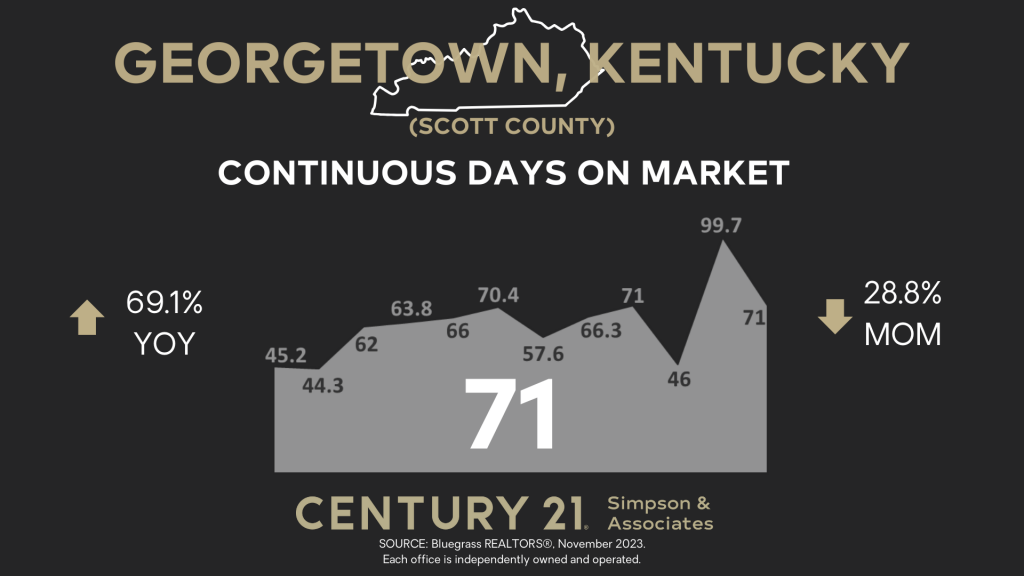
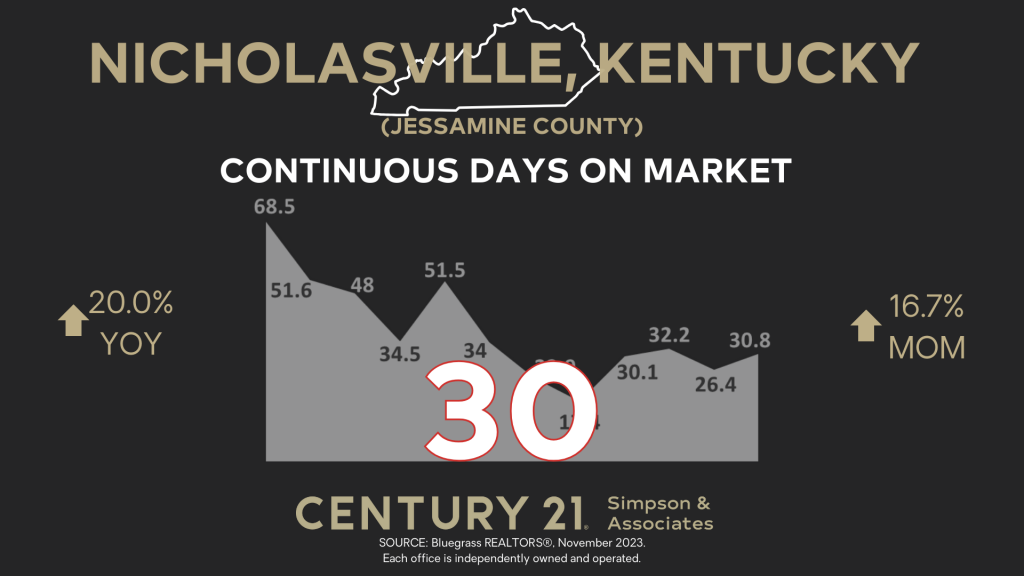
Days on Market is our final indicator and helps answer the question, “How does my home compare to others on the market?” Like many of the other indicators, it also provides insights into, “How quickly is the market moving?”
The Days on Market indicator helps us determine if our pricing is correct or if there is some other market resistance, potentially leading to reduced buyer interest and negotiating power.
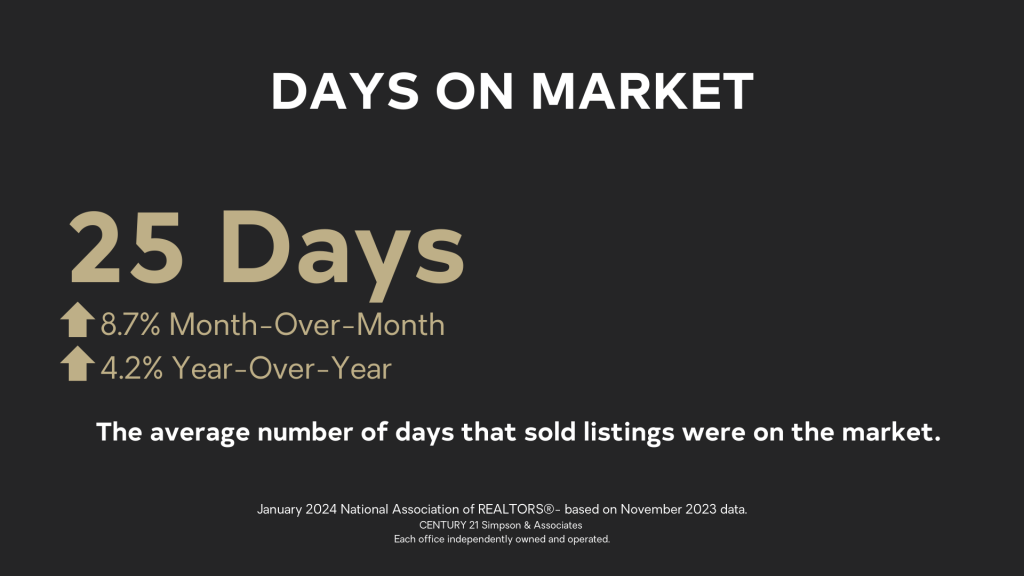
The Days on Market is the average number of days that sold listings were on the market. Those days are calculated from the day a property is listed until it goes under contract. If there were any days the property was off the market, then those days are subtracted.
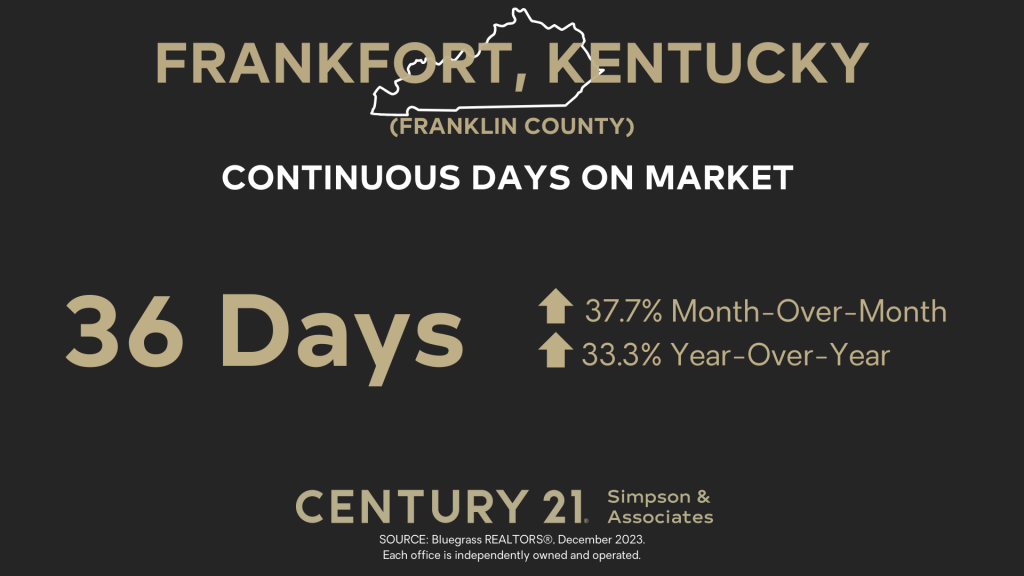
Days on Market is at 36 days, which is up 37.7% from last month and 33.3% over last year.
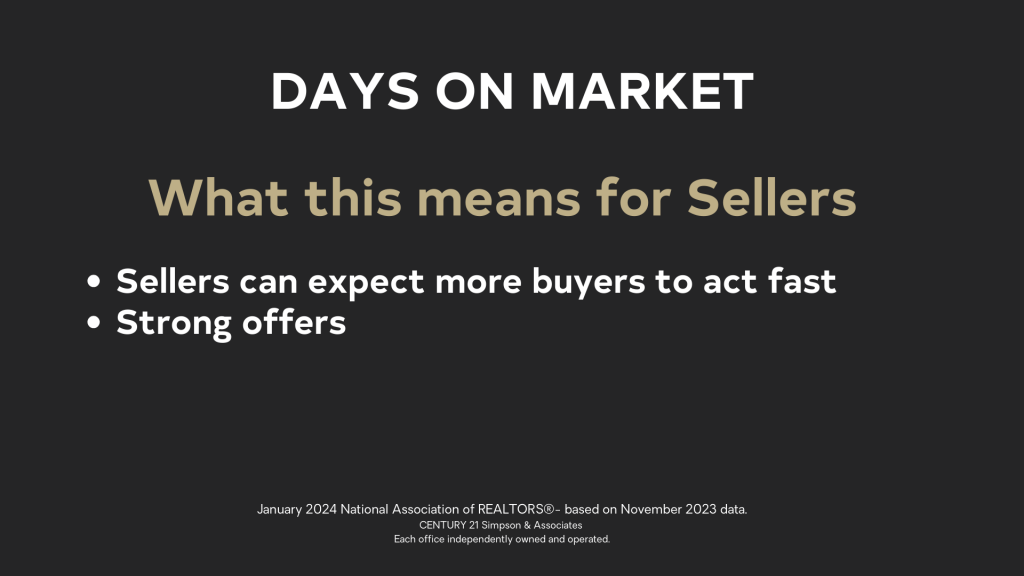
Pricing and condition matter and should be reconsidered if a home is on market longer than average. As rates fall and competition increases, sellers can expect more buyers to act fast and be ready with strong offers.
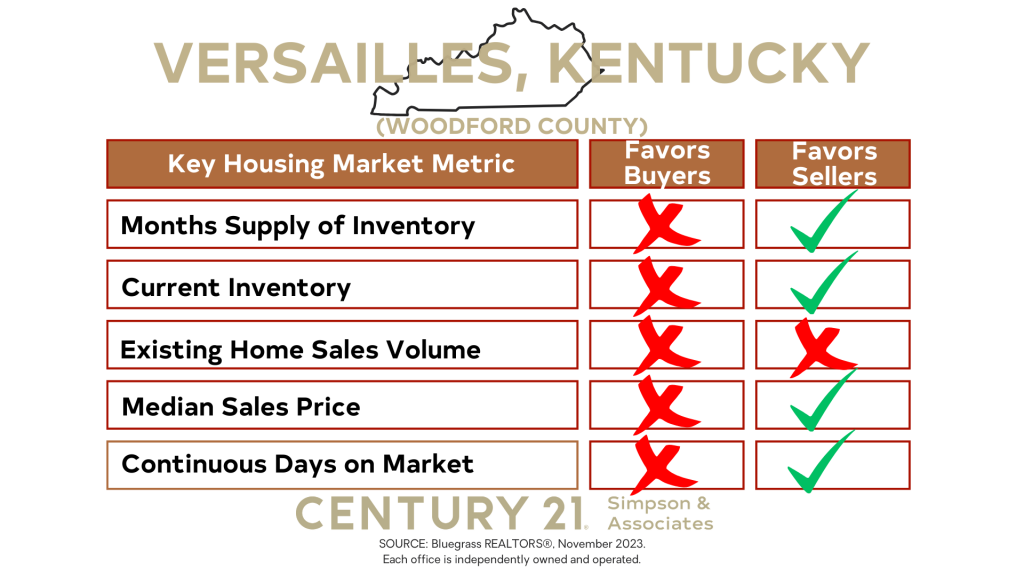
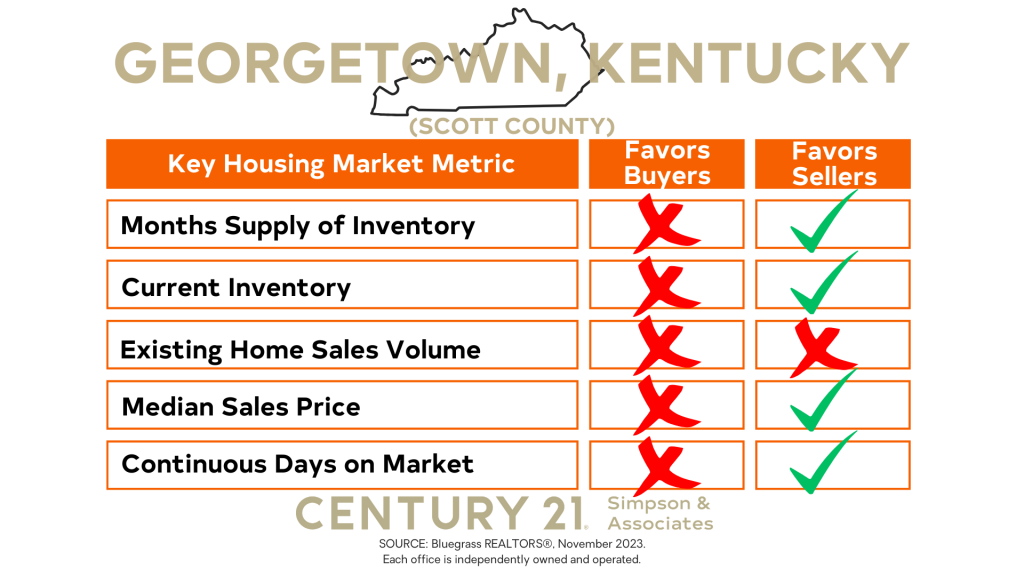
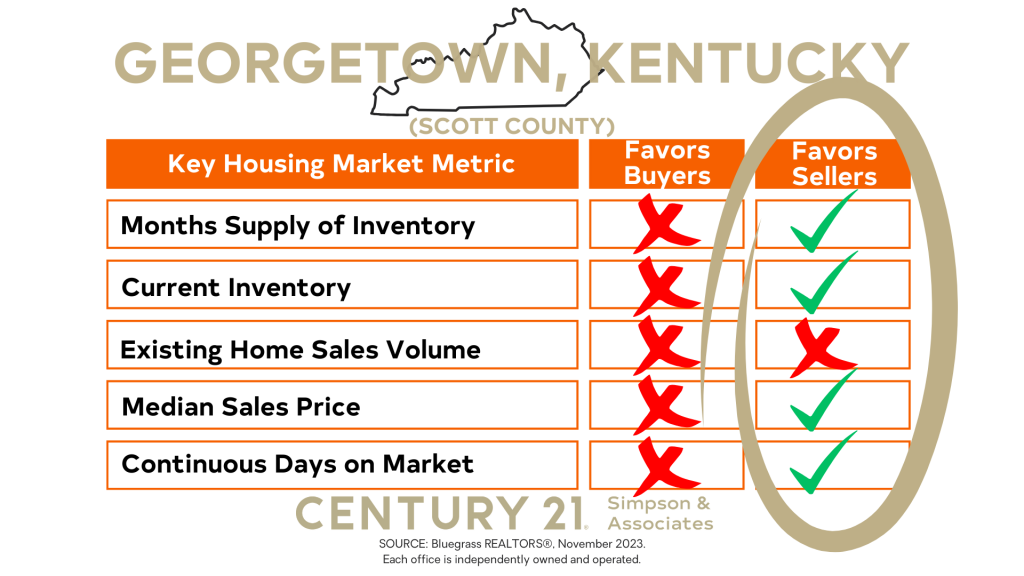
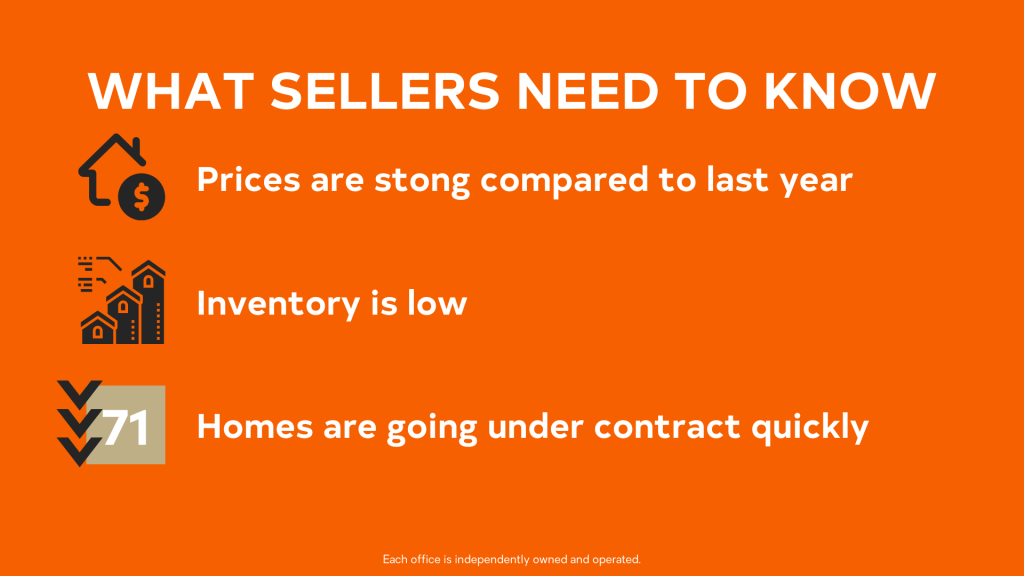
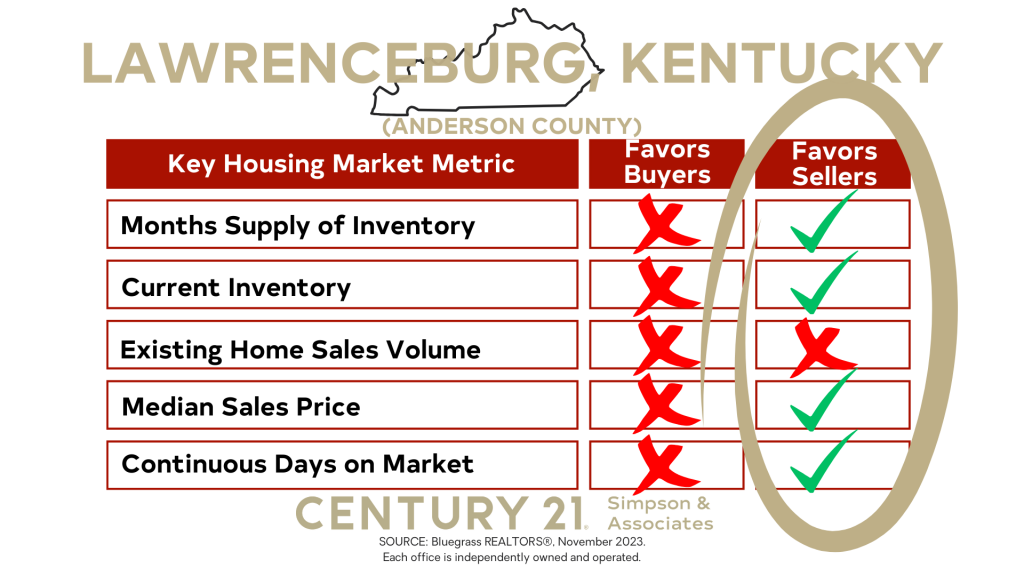
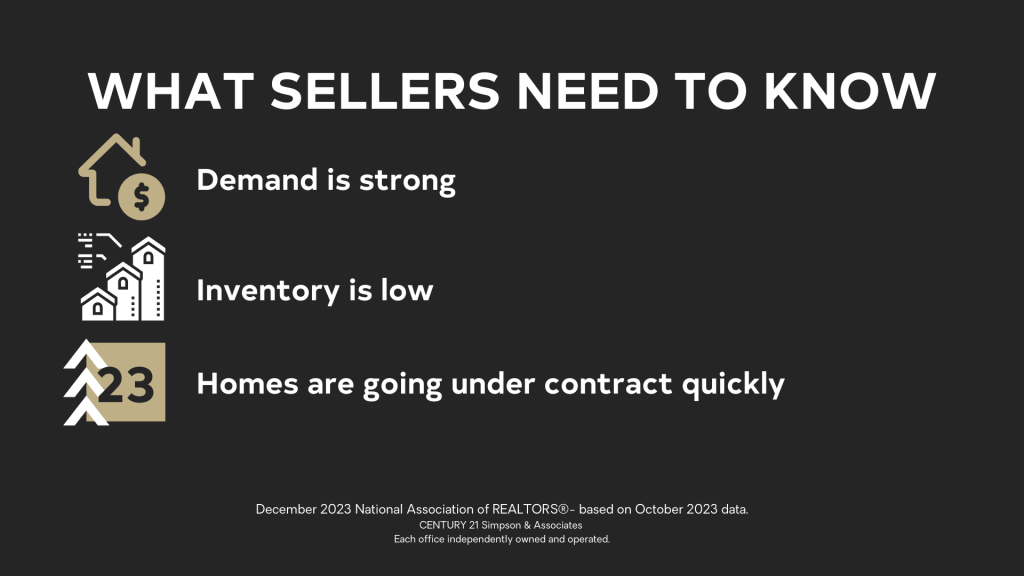
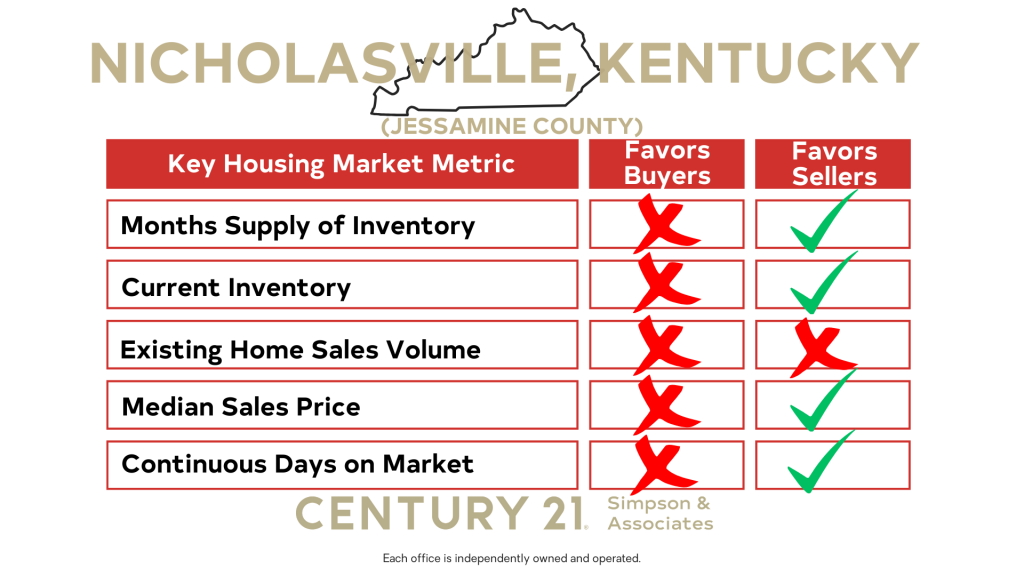
Let’s recap what these indicators mean for sellers and make sure we answered the most frequently asked questions of home sellers.
Is it a sellers’ market? Yes
Tight inventory continues to be a major factor fueling this market. With 1.75 months of listings on the market, more buyers are expected to enter the market and prices will likely rise.
How quickly is the market moving? Fast
There are 52 days of inventory available, and homes are going under contract in just 36 days. Tight inventory and strong buyer demand could lead to more price increases over time.
What are the pricing trends? Increasing
Sellers can still capitalize on historically high prices and continued buyer demand. 2023 median sales prices are above those of 2022 and 2021.
Do mortgage interest rates affect sellers? Mortgage rates determine the size of the buyer pool and the speed of the selling process.
Mortgage interest rates have dropped to the mid-6% range in December. Buyers who were priced out of the market this fall are expected to return—increasing competition.
How does my home compare to others on the market? Price and Condition Matter
Homes were on the market for 36 days in December. Pricing and condition matter and should be reconsidered if a home is on the market longer than average. As rates fall and competition increases, sellers can expect more buyers to act fast.
If you have a home to sell and were feeling like you missed your window, don’t miss this one!
Timing the market is nearly impossible! The best we can do is read and react to the data available, and it’s sending a clear message: If you’re ready to sell, it’s best to act now! With falling rates, buyer demand is expected to rise. Tight inventory means listings are poised to be in demand.
Let us, or have your REALTOR run the numbers based on the market and see if that achieves your financial goals.
Call our Frankfort or Lexington Offices or reach out to one of our real estate agents if you have any questions.
In addition to this Frankfort-Franklin County market update, we cover other Central Kentucky counties. Watch our local real estate market update videos for Georgetown-Scott County, Lawrenceburg-Anderson County, Lexington-Fayette County, Nicholasville-Jessamine County, and Versailles-Woodford County as well as our monthly national real estate market update.
Please join us next month for more insights.


![Planting by the Signs [Plantar por los signos]- Phil Case](https://century21simpson.com/files/2023/12/Planting-by-the-Signs-Phil-Case.png)